Fig. 4.
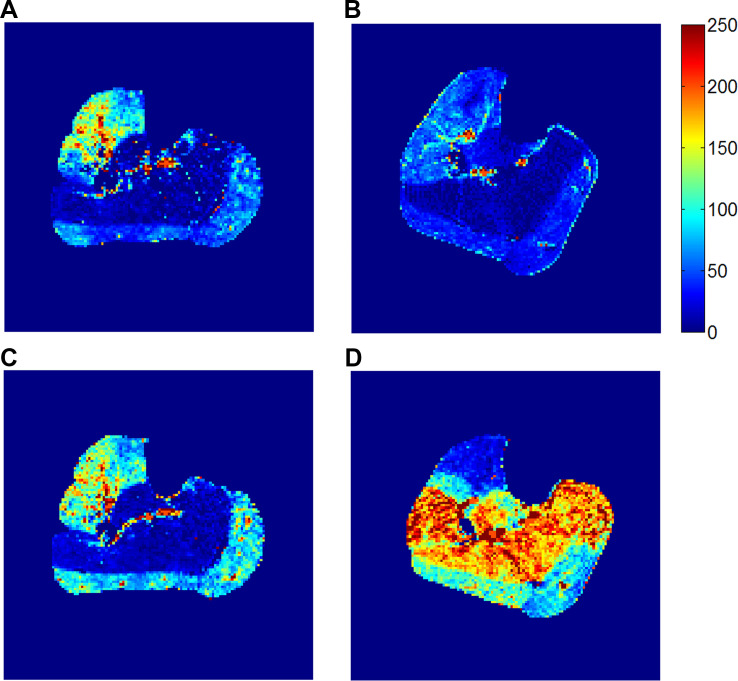
Calf muscle perfusion maps measured with the dual-intensity protocol (group C). A and B: perfusion map after the low-intensity exercise (4-lb load for 3 min) for a healthy elderly subject (man, 64 yr old; A) and for a patient with peripheral artery disease (PAD; man, 61 yr old, right-leg ankle-brachial index: 0.84; B). C and D: perfusion map after the exhaustion exercise for the healthy subject (exercised for 6 min to 12 lb; C) and for the patient with PAD (exercised for 9 min to 18 lb; D). In contrast to the healthy subject, the patient with PAD had a much higher perfusion increase in the soleus than in the gastrocnemius from the low-intensity to the exhaustion exercise. Units for the perfusion are ml·min−1·100 g−1.

