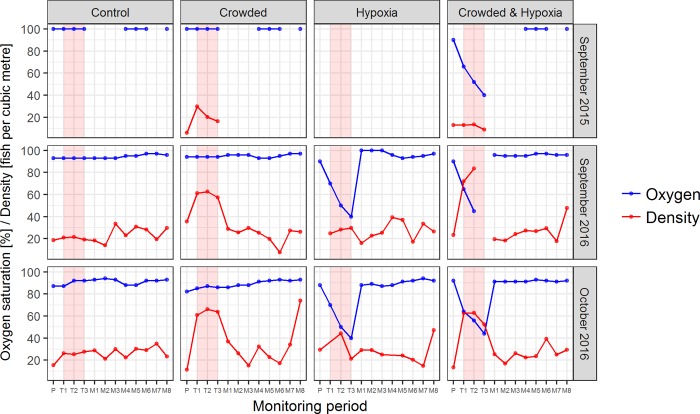
Fig 2. Crowding and hypoxia treatments.
Oxygen (dissolved oxygen saturation, blue line) and crowding (fish density, red line) conditions throughout monitoring periods during different stressor treatments, for the three experimental phases. The red shaded area indicates the monitoring periods corresponding to the application of the stressor. For the September 2015 phase, no hypoxia treatment was applied and no density estimates were collected in the post-treatment monitoring periods or at any point during the control treatment.

