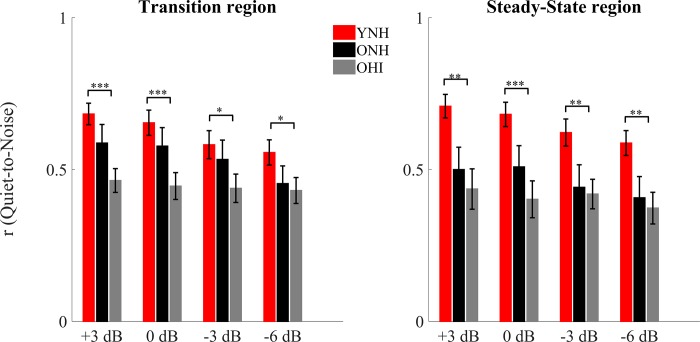
Fig 4.
Pearson correlation coefficients ± 1 SE of the quiet-to-noise correlation for YNH (red), ONH (black) and OHI (gray) in the transition (left) and steady-state (right) regions for all of the noise levels tested. Significant differences were noted between YNH and OHI but not between YNH and ONH or ONH and OHI. p-values in this figure refer to the results of the post-hoc independent t-tests analysis. *P < 0.05, **p < 0.01, ***p < 0.001.

