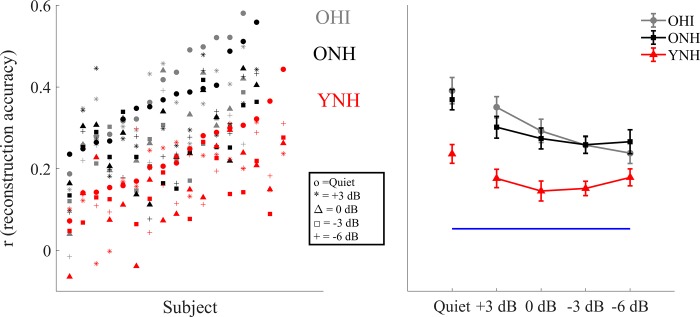
Fig 5. Correlation values measured in the MEG experiment.
Left: plots of r values for each YNH (red), ONH (black) and OHI (gray) participant at each condition tested (o = Quiet, * = +3 dB, Δ = 0 dB, Υ = -3 dB, + = -6 dB) plotted in ascending noise order with respect to the quiet condition. Right: Reconstruction accuracy value 1 ± SE of the speech envelope of the foreground for YNH, ONH and OHI in quiet and in noise. The bottom horizontal line shows the noise floor. Older adults’ reconstruction fidelity is significantly better than that of the younger adults at all of the noise levels tested, but at -6 dB in OHI. No significant differences and no interactions were found between ONH and OHI.

