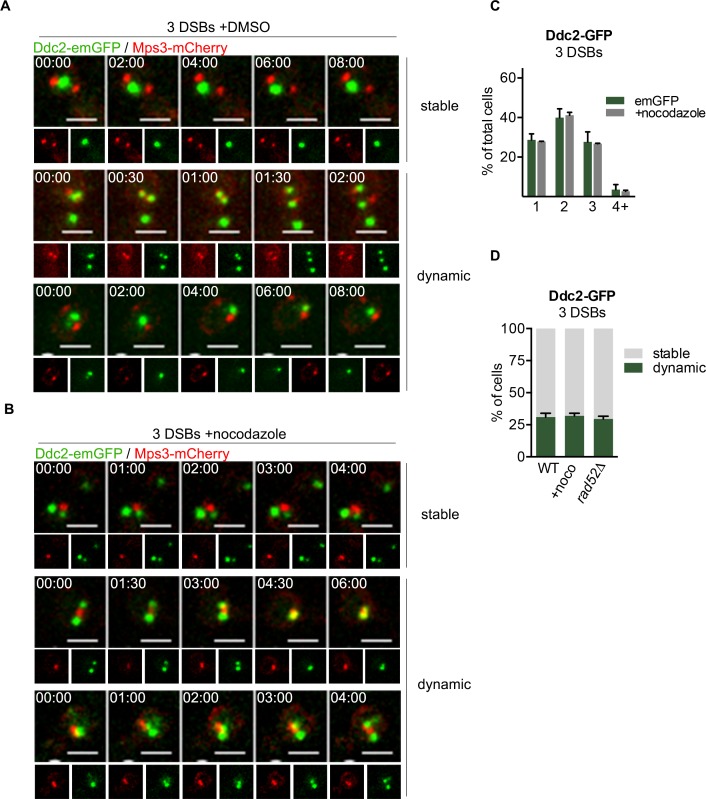
Fig 2. DSBs are dynamic.
A) Single images of Ddc2-emGFP and Mps3-mCherry 3 h after HO induction in a 3 DSB strain. Scale bar = 2 μm. Time after start of image capture displayed. B) Identical to (A), but after treatment with 15 μg/ml nocodazole for 10 minutes before imaging. C) Ddc2-emGFP focus abundance in cells treated with DMSO (vehicle) or nocodazole, 3 h after galactose addition. D) Percentage of stable vs dynamic DSBs observed in (A) and (B). Data representative of three individual experiments examining >200 cells each.

