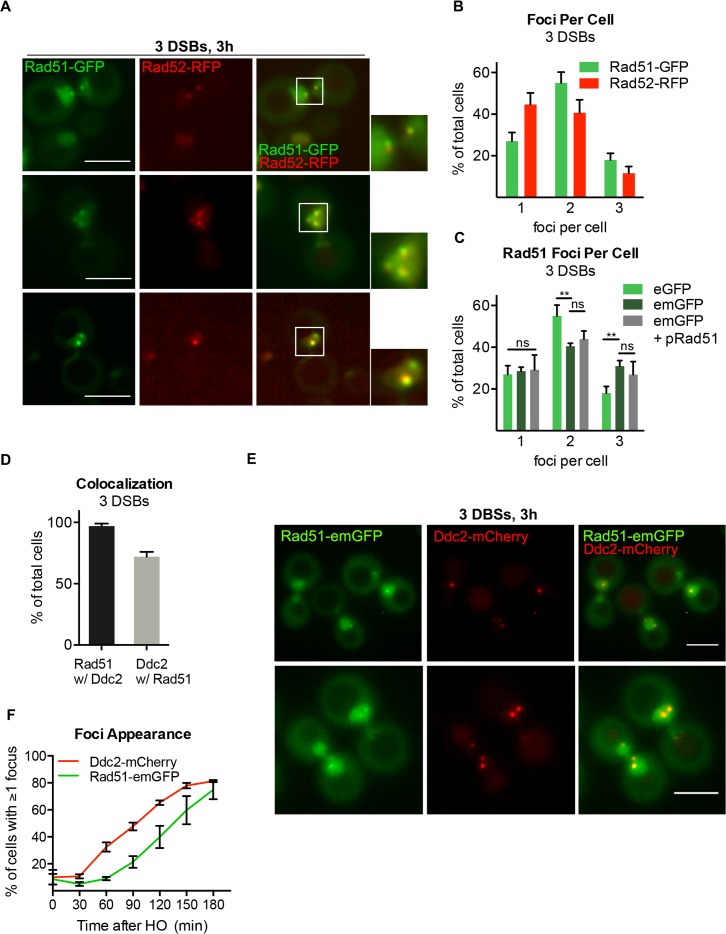
Fig 6. Rad51-GFP forms multiple foci in response to multiple DSBs.
A) Representative images from strain DW106 expressing endogenous Rad51-eGFP and Rad52-RFP 3 h after HO induction. Magnification of white-boxed nucleus shown to the right. Maximum projection of 10–12 z-stack images every 0.5 μm. Scale bar = 5 μm. B) Rad51-GFP and Rad52-RFP foci in DW106 3 h after induction of HO. Error bars represent the SD of three biological replicates of >150 cells per experiment. C) Rad51-emGFP and Rad51-emGFP + pRad51 foci 3 h after HO induction. Rad51-eGFP data reproduced from (B) for comparison. Error bars presented as in (B). D) Percentage of Rad51-emGFP foci containing Ddc2-mCherry foci versus percentage of Ddc2-mCherry foci containing Rad51-emGFP foci 3h after HO induction. Error bars presented as in (B) E) Representative fluorescence images from cells expressing Ddc2-mCherry and Rad51-emGFP 3 h after HO induction in a 3 DSB strain. F) Percentage of cells displaying at least one Ddc2-mCherry or Rad51-emGFP focus at the indicated time after HO induction in a 3-DSB strain. Error bars presented as in (B).

