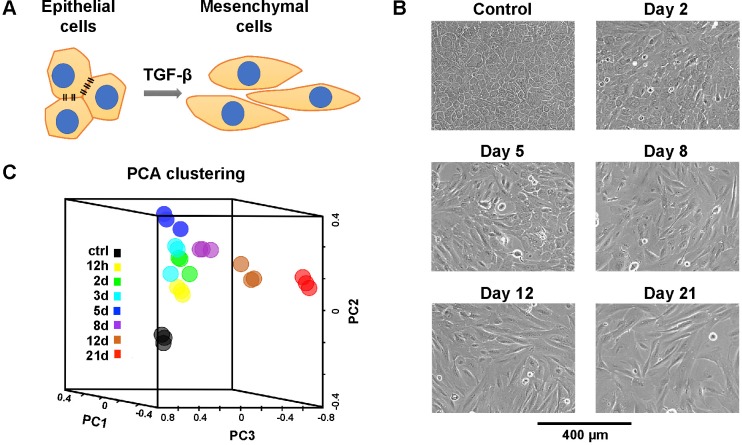
Fig 1. MCF10A cell responses to TGF-β treatment.
(A) Schematic diagram of phenotypic transition from epithelial cells to mesenchymal cells in response to TGF-β treatment. (B) MCF10A cells undergo morphological changes in responses to 4 ng/ml TGF-β. (C) PCA clustering of TGF-β treated MCF10A cells reveals distinct gene expression patterns over time.

