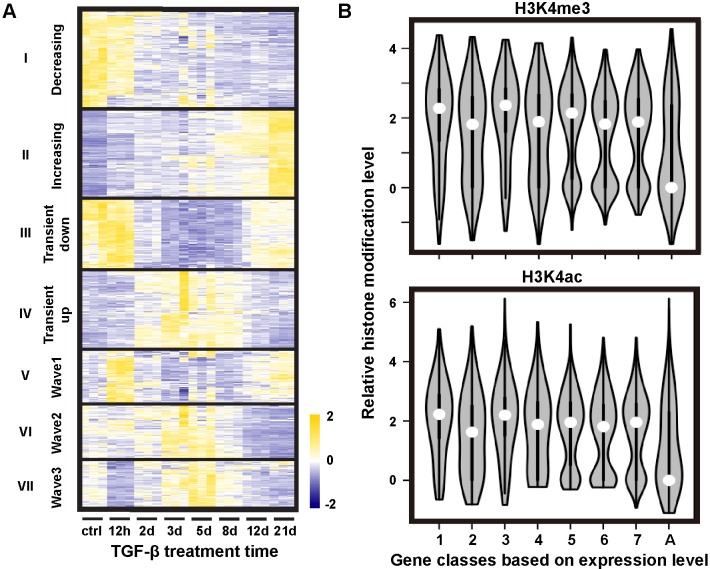
Fig 2. TGF-β induced gene expression changes show distinct temporal patterns.
(A) Hierarchical clustering of genes based on temporal gene expression patterns only. (B) Violin plots of distributions of indicated histone modification levels sampled through genes belonging to individual hierarchical clusters. Numbers 1–7 on the x-axis follow the order of gene clusters in panel A. The control group ‘A’ was sampled through all genes.

