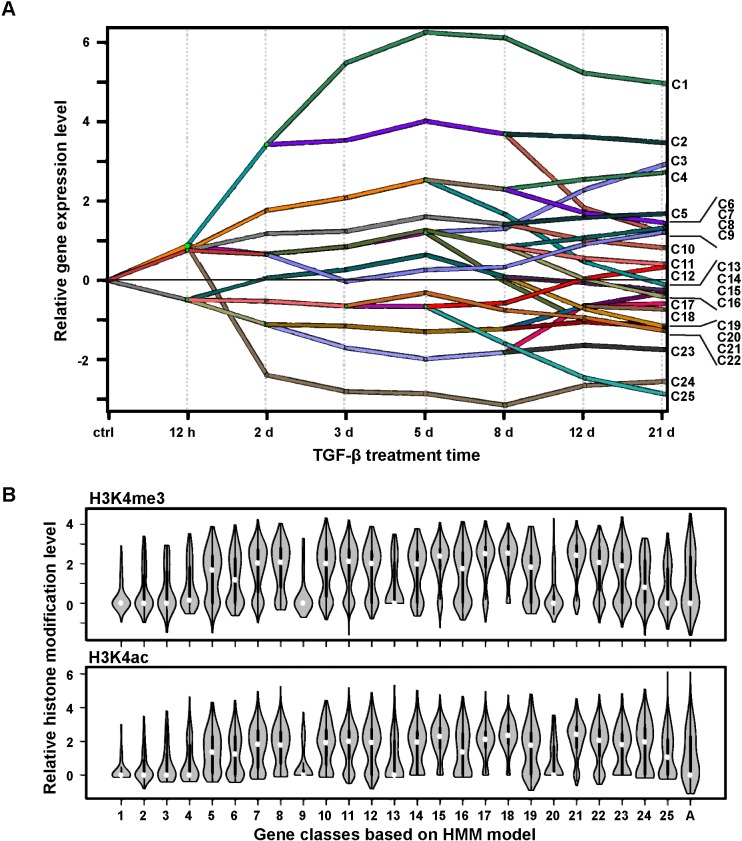
Fig 3. Genes clustered based on both expression patterns and key transcription factors show a correlation between patterns of expression and histone modification.
(A) Dynamic regulatory map obtained through the DREM2 analysis. (B) Distribution of indicated histone modification levels sampled through genes belonging to individual HMM classes. Group ‘A’ represents the control group that includes all genes.

