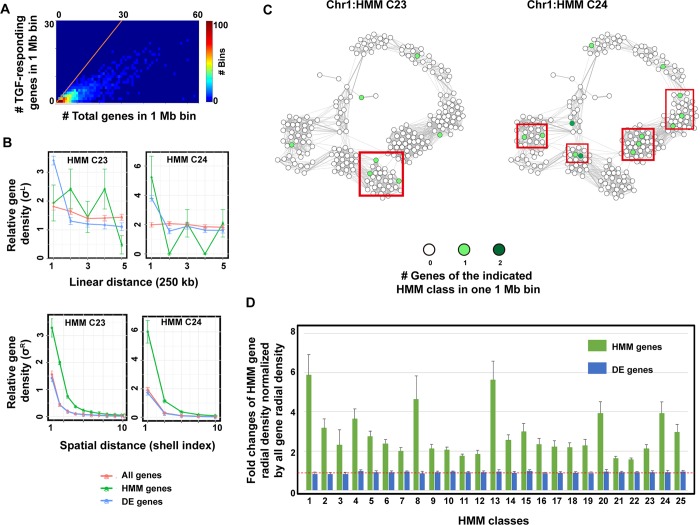
Fig 4. Genes with similar expression patterns and controlled by the same up-stream regulators show an enhanced tendency to co-localize spatially in the 3D chromosome structure.
(A) Heat map shows the numbers of 1-Mb bins containing a given number of genes and TGF-β responding genes. The orange line highlights the bins in which all genes responded to TGF-β treatment. (B) Linear and radial distribution functions of TGF-β-responding genes within two representative HMM classes. We calculated the distribution of genes by sampling three types of gene groups: all available genes (All genes, and ), genes within an indicated HMM group (HMM genes, and ), and genes that showed differential expression during TGF-β treatment (DE genes, and ). For spatial distance, with the shell width Δr approx 60 nm. (C) Pseudo-spatial arrangement of genes belonging to two representative HMM classes, respectively. Each circle indicates a 1-Mb bin. The gray level in a circle scales to the number of genes in the bin that belongs to the indicated HMM class. The two-dimensional spatial arrangement of bins within one chromosome was calculated by a fast-greedy algorithm based on the contact frequencies between each pair of bins from Hi-C data. The line width between two circles is proportional to the contact frequencies between the two corresponding bins. Genes within each red box are within ~ 300 nm in space. (D) Relative gene densities of all HMM classes within the first shell of the radial distributions normalized by the average density of all genes around the targeted genes in the first shell (i.e., and .

