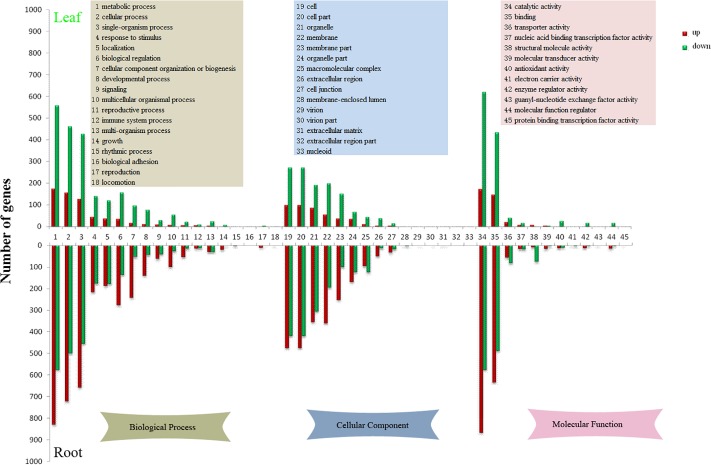
Fig 2. Histogram of level 2 GO terms of CL-VS-TL and CR-VS-TR.
The upper part of the figure shows level 2 GO terms of CL-VS-TL, the lower part of the figure shows level 2 GO terms of CR-VS-TR. The red bars show up-regulated unigenes and green shows down-regulated unigenes. The yellow rectangle shows GO terms of biological process, the blue rectangle shows GO terms of cellular component, and the pink rectangle shows GO terms of molecular function.

