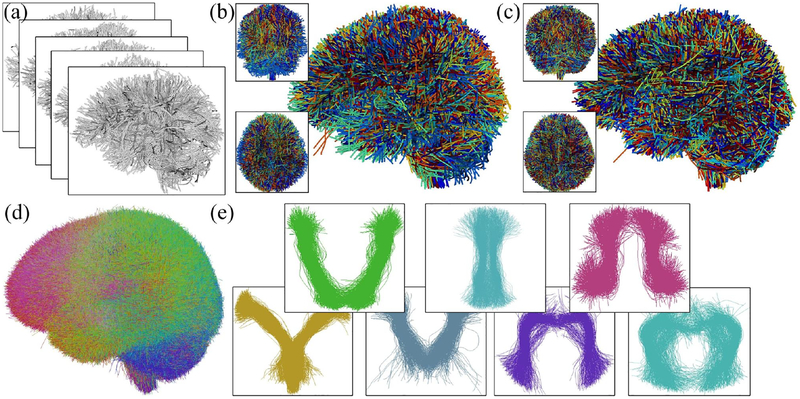
Figure 2:
Overview of the data-driven groupwise whole brain fiber clustering. Input tractography across all subjects (a) for data-driven learning of a white matter parcellation. Sub figures (b) and (c) show the overlaid tractography from 10 randomly selected example subjects (different colors indicate different subjects) before and after the groupwise tractography registration. Then, group-wise clustering produces the fiber atlas (d), where the colors represent different atlas fiber clusters. Some example clusters are displayed in (e).

