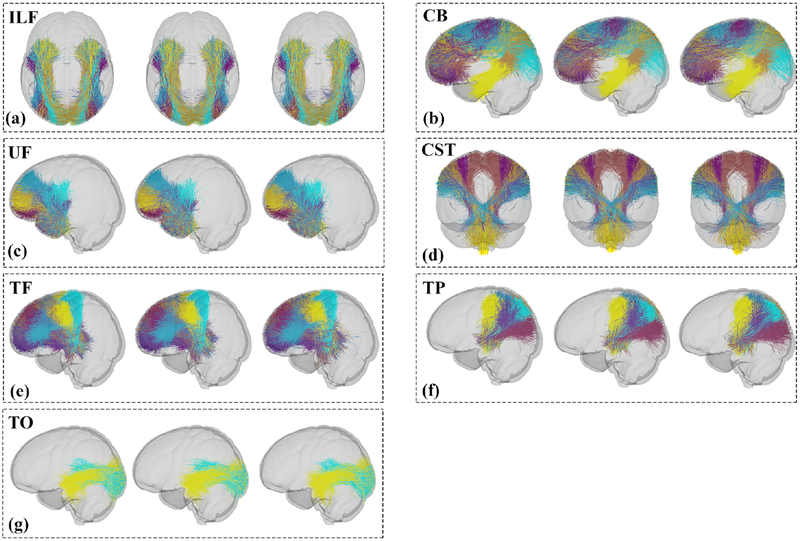
Figure 4:
Visualization of the fiber tracts (each cluster has a different color) annotated by AAFC. The first image in each box shows the tract in the atlas. The second and third images show the fiber tracts from the HC and MDD groups, respectively. (a) Inferior Longitudinal Fasciculus (ILF) is the union of 6 fiber clusters; (b) Cingulum Bundle (CB) is the union of 14 fiber clusters; (c) Uncinate Fasciculus (UF) is the union of 8 fiber clusters;(d) Corticospinal Tract (CST) is the union of 7 fiber clusters; (e) Thalamo-Frontal fibers (TF) is the union of 16 fiber clusters; (f) Thalamo-Parietal fibers (TP) is the union of 7 fiber clusters; (g) Thalamo-Occipital fibers (TO) is the union of 2 fiber clusters. A partially transparent model of the brain is displayed as a background to show the relative position of each tract in the brain.

