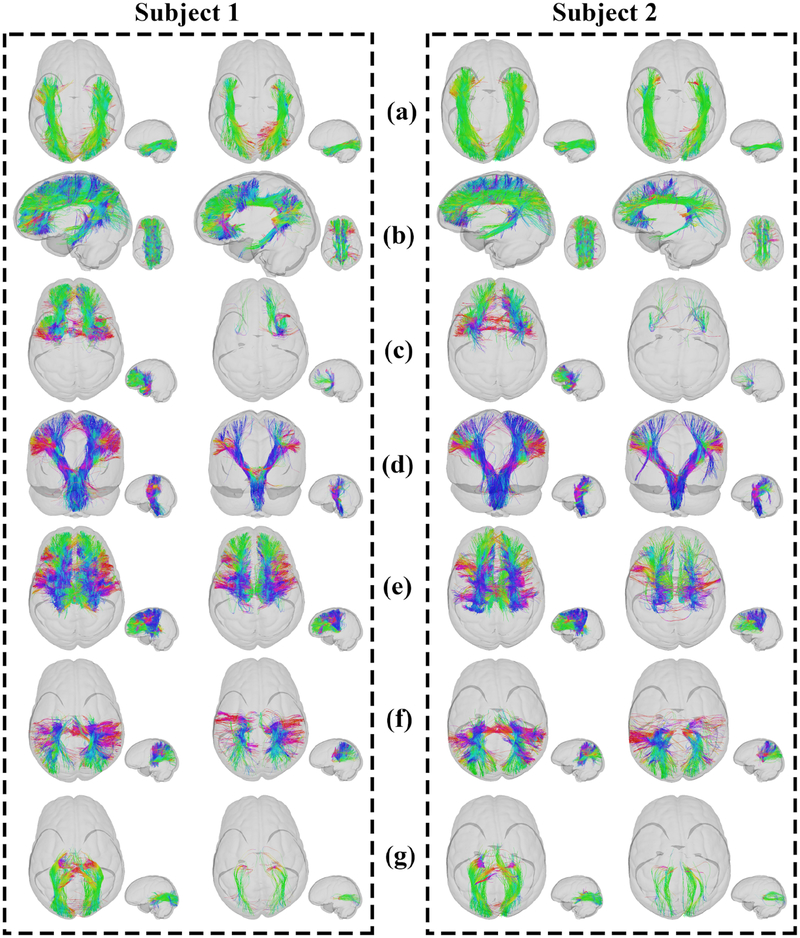
Figure 5:
Visual presentation of the AAFC method (left) and the WMQL method (right) results segmenting fiber tracts, ILF, CB, UF, CST, TF, TP and TO, respectively. Two subjects (one MDD subject (Subject 1) and one HC subject (Subject 2)) were randomly selected for visualization. Fibers in each tract are colored by the fiber orientation.

