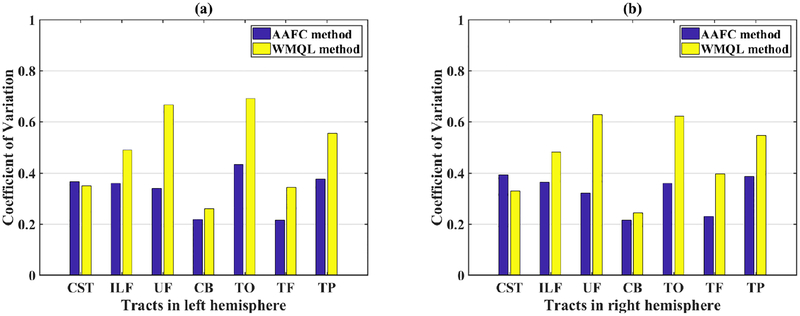
Figure 6:
Coefficient of variation (CV) of the number of fibers from each tract across all subjects, as identified by WMQL and the proposed AAFC method. (a) Left hemisphere (p = 0.0153, two-tailed paired t-test of CV across seven left-hemisphere tracts between AAFC and WMQL); (b) Right hemisphere (p = 0.0274, two-tailed paired t-test of CV across seven right-hemisphere tracts between AAFC and WMQL). Lower CV values indicate lower variability across subjects.

