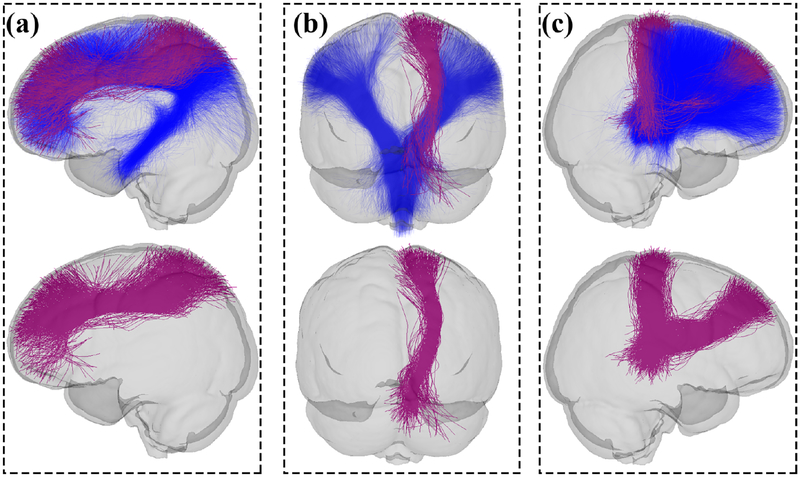
Figure 8:
Visualization of CST (a), CB (b) and TF (c) tracts showing significant differences in FA (CST) and MD (CB and TF) in the MDD patients compared with the HCs. The first row displays the significant clusters overlaid on the whole tract to show the relative position of the significant clusters. The second row shows only the significant clusters for a better visualization. Red parts represent the fiber clusters with significant difference (1 fiber cluster in the identified right-hemisphere CST had significantly increased FA in MDD, 4 fiber clusters in the identified left-hemisphere CB had significantly decreased MD in MDD, and 2 fiber clusters in the identified right-hemisphere TF had significantly decreased MD in MDD). A partially transparent model of the brain is displayed as a background to show the relative position of each tract in the brain.

