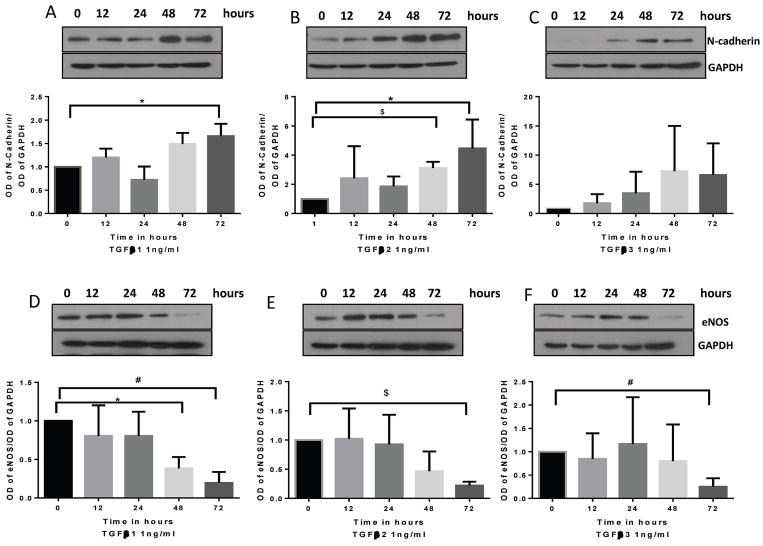
FIGURE 1. TGFβ- induced EndMT in HMECs is a long-term process.
(A–C) Representative Western blot images and the corresponding bar graph of band densitometry showing a gradual increase in the expression of mesenchymal marker N-Cadherin in HMECs treated with 1 ng/ml of TGFβ1, 2 and 3 for 0, 12, 24, 48 and 72 hours. (D–E) Representative Western blot images and the corresponding bar graph of band densitometry showing a gradual decrease in the expression of endothelial marker eNOS in HMECs treated with 1 ng/ml of TGFβ1, 2 and 3 for 0, 12, 24, 48 and 72 hours. Data are represented as mean ± SD. (n=3–5), *p<0.05; #p<0.0;, $p<0.001.

