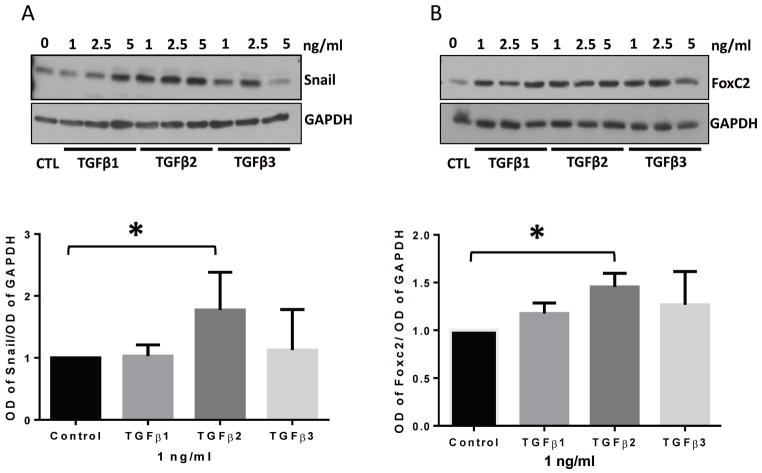
FIGURE 5. TGFβ2 is a more potent stimulator of mesenchymal transcription factor expression in HMECs compared to TGFβ1 and TGFβ3.
(A) Representative Western blot images and the corresponding bar graph of band densitometry showing increased expression of mesenchymal transcription factor Snail in HMECs in response to 1, 2.5 and 5 ng/ml of TGFβ1, TGFβ2, and TGFβ3 for 72 hours. (B) Representative Western blot images and the corresponding bar graph of band densitometry showing increased expression of mesenchymal transcription factor FoxC2 in HMECs in response to 1, 2.5 and 5 ng/ml of TGFβ1, TGFβ2, and TGFβ3 for 72 hours. Data are represented as mean ± SD. (n=3–5), *p<0.05.

