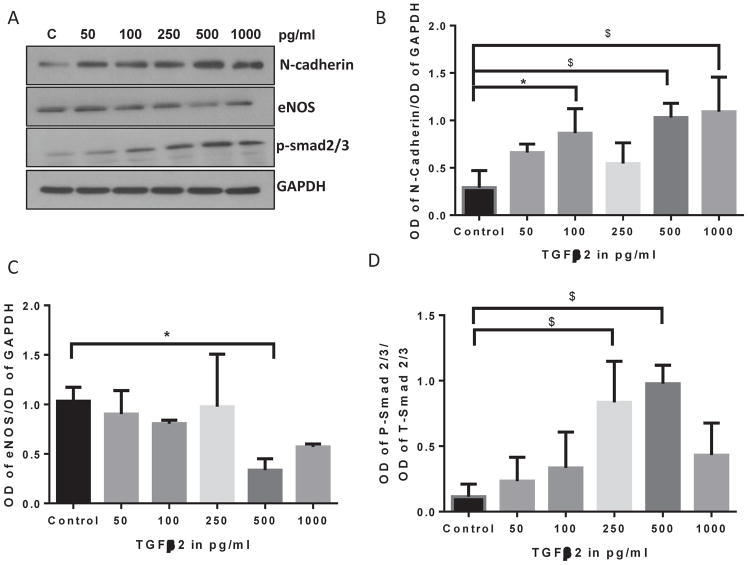
FIGURE 6. TGFβ2 induces EndMT at lower doses.
(A) Representative Western blot images showing a gradual increase in the expression of mesenchymal marker N-Cadherin associated with increased p-smad2/3 and decreased eNOS levels in HMECs treated with TGFβ1 for 72 hours with 0, 50, 100, 250, 500 and 1000 pg/ml doses. (B–D) Corresponding bar graph of band densitometry showing a gradual decrease a gradual increase in the expression of mesenchymal marker N-Cadherin associated with increased p-smad2/3 and decreased eNOS levels in HMECs treated with TGFβ1 for 72 hours with 0, 50, 100, 250, 500 and 1000 pg/ml doses. Data are represented as mean ± SD. (n=3–5), *p<0.05; $p<0.001.

