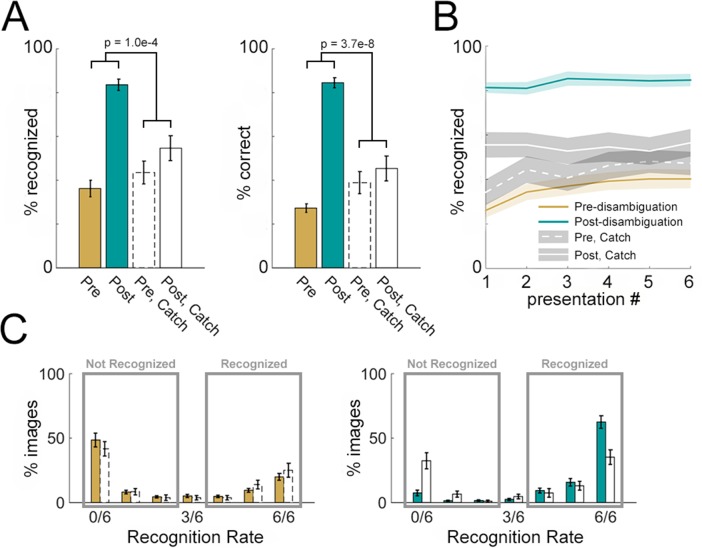
Figure 2. Disambiguation-related behavioral effects.
(A) Subjective recognition rates (left, averaged across six presentations) and correct verbal identification rates (right) for Mooney images presented in the pre- and post- disambiguation period (gold and teal bars). Corresponding results for catch images are shown in open bars. p-Values corresponding to the interaction effect (pre vs. post × catch vs. non-catch) of two-way ANOVAs are shown in the graph. (B) Subjective recognition rates grouped by presentation number in the pre- and post- disambiguation stage (gold and teal), as well as the corresponding rates for catch images (white lines). (C) Distribution of subjective recognition rates across Mooney images in the pre- (gold bars, left) and post- (teal bars, right) disambiguation stage. Corresponding distributions for catch images are shown as open bars. All results show mean and s.e.m. across subjects.

