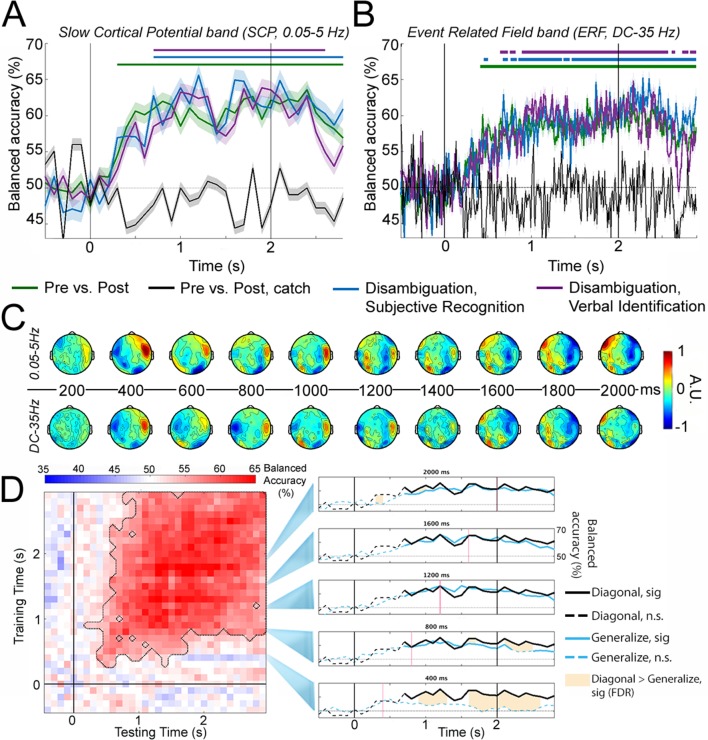
Figure 3. Decoding perceptual state information.
(A) Decoding accuracy using SCP (0.05–5 Hz) activity across all sensors. Classifiers were constructed to decode i) presentation stage for all 33 Mooney images (Pre vs. Post; green); ii) presentation stage using only Mooney images that are not recognized pre-disambiguation and recognized post-disambiguation (Disambiguation, subjective recognition; blue); iii) presentation stage using only Mooney images that are not identified pre-disambiguation and identified post-disambiguation (Disambiguation, verbal identification; magenta); iv) ‘presentation stage’ for catch images, where the grayscale images did not match the Mooney images (black). Shaded areas represent s.e.m. across subjects. Horizontal bars indicate significant time points (p<0.05, cluster-based permutation tests). (B) Same as A, but for ERF (DC – 35 Hz) activity. (C) Activation patterns transformed from decoder weight vectors of the ‘Disambiguation, subjective recognition’ decoder constructed using SCP (top row) and ERF (bottom row) activity, respectively. (D) Left: TGM for the ‘Disambiguation, subjective recognition’ decoder constructed using SCP. Significance is outlined by the dotted black trace. Right: Cross-time generalization accuracy for classifiers trained at five different time points (marked as red vertical lines; blue traces, corresponding to rows in the TGM). The within-time decoding accuracy (corresponding to the diagonal of the TGM and blue trace in A) is plotted in black for comparison. Solid traces show significant decoding (p<0.05, cluster-based permutation test); shaded areas denote significant differences between within- and across- time decoding (p<0.05, FDR corrected). The black vertical bars in A, B, and D denote onset (0 s) and offset (2 s) of image presentation.

