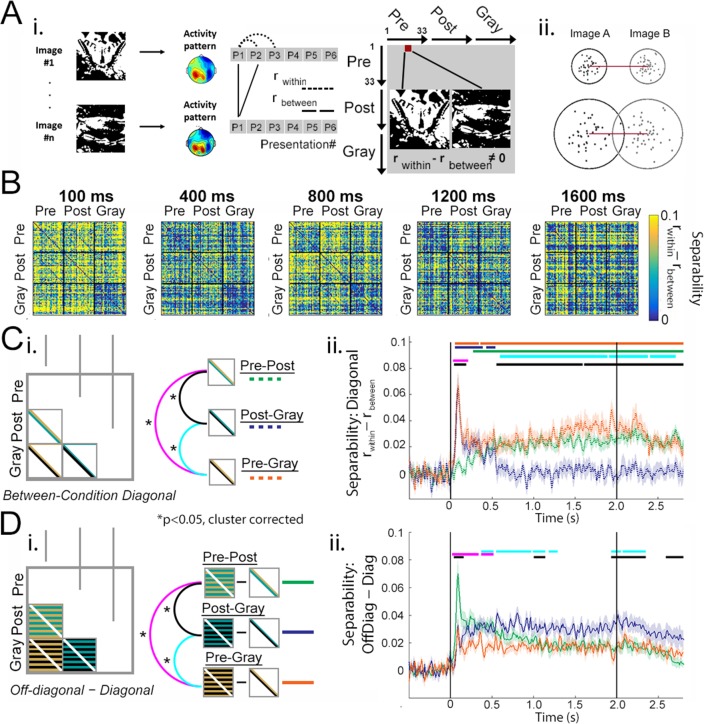
Figure 5. Single-trial separability analysis.
(A) i: Schematic for separability calculation. For details, see Materials and methods, Single-trial separability. ii: Two hypothetical examples of single-trial neural activity patterns (projected to a 2-D plane) for Image A (black dots) and Image B (gray dots). The neural dissimilarity calculated based on trial-averaged activity patterns (1 – r measure used earlier) is identical between the two examples, while single-trial separability (rwithin - rbetween) is higher in the top example. (B) Group-average MEG RDMs computed with the separability (rwithin - rbetween) measure at selected time points. (C) Quantifying separability between neural activity patterns elicited by the same/matching image presented in different conditions. (i) Analysis schematic: diagonal elements in the between-condition squares of the RDM are averaged together, yielding three time-dependent outputs corresponding to the three condition-pairs. (ii) Separability time courses averaged across 33 real image sets for each between-condition comparison, following the color legend shown in C-i. The top three horizontal bars represent significant (p<0.05, cluster-based permutation test) time points of each time course compared to chance level (0); and the bottom three bars represent significance of pairwise comparisons between the time courses. (D) Quantifying the difference between off-diagonal and diagonal elements in the between-condition squares of the separability RDMs. Intuitively, this analysis captures how similar an image is to itself or its matching version presented in a different condition over and above its similarity to other images presented in that same condition. Statistical significance (p<0.05, cluster-based permutation test) for pairwise comparisons are shown as horizontal bars. When compared to chance (0), the three traces are significant from 40 ms (Pre-Post), 50 ms (Pre-Gray), and 60 ms (Post-Gray) onward until after image offset, respectively. Traces in C-ii- and D-ii show mean and s.e.m. across subjects.

