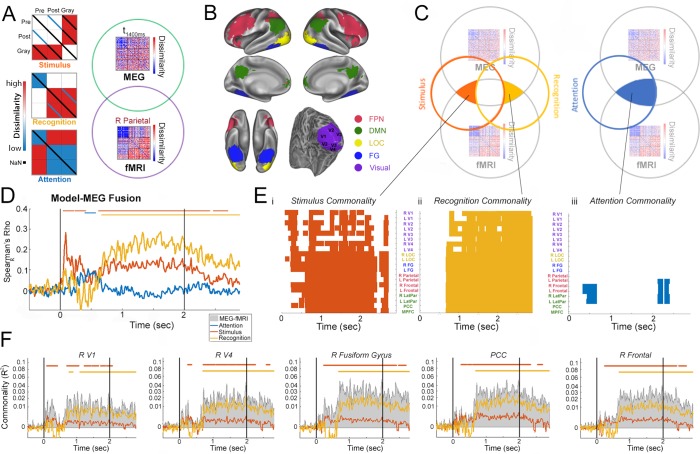
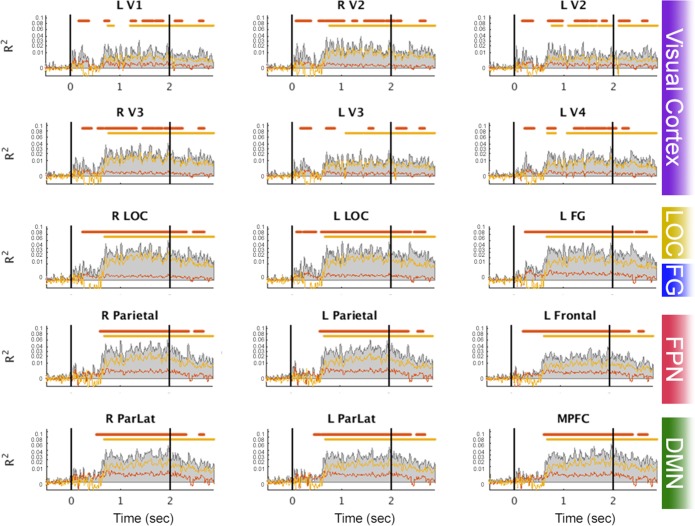
Figure 6. Model-based MEG-fMRI fusion analysis.
(A) Model RDMs and analysis cartoon. Left: RDMs corresponding to ‘Stimulus’, ‘Recognition’, and ‘Attention’ models. For details, see Results. Right: MEG RDM from each time point and fMRI RDM from each ROI are compared, and shared variance between them that is accounted for by each model is computed. (B) ROIs used in the fMRI analysis. For details, see Materials and methods. These were defined based on a previous study (González-García et al., 2018). (C) Schematics for the commonality analyses employed in the model-based MEG-fMRI data fusion (results shown in E-F). Because neural activities related to the Stimulus and Recognition model overlap in time (see D), to dissociate them, variance uniquely attributed to each model was calculated (left). Shared variance between MEG and fMRI RDMs accounted for by the attention model is also assessed (right). (D) Correlation between model RDMs and MEG RDMs at each time point. Horizontal bars denote significant correlation (p<0.05, cluster-based permutation tests). (E) Commonality analysis results for Stimulus (i), Recognition (ii), and Attention (iii) models. Colors denote significant (p<0.05, cluster-based permutation tests) presence of neural activity corresponding to the model in a given ROI and at a given time point (with 10 ms steps). (F) Commonality time courses for the Stimulus (red) and Recognition (yellow) model (analysis schematic shown in panel C, left) for five selected ROIs, showing shared MEG-fMRI variance explained by each model. Total shared variance between MEG and fMRI RDMs for each ROI is plotted as gray shaded area. PCC: posterior cingulate cortex; R Frontal: right frontal cortex in the FPN. Horizontal bars denote significant model-related commonality (p<0.05, cluster-based permutation tests).


