. 2019 Feb 8;8:e42670. doi: 10.7554/eLife.42670

Figure 5. Improved survival and decreased local and systemic cytokine secretion in response to Connexin-43 blocking or deletion during abdominal sepsis.

(A–B) Clinical outcome using Murine Sepsis Score and weight loss following CLP (N = 5 animals per group, two-way ANOVA). (C) Survival of mice following caecal ligation and puncture (CLP). Mice treated with Gap27 (blue, N = 6 animals), a specific CX43 blocker, homozygous (Lyz2cre/cre, Gja1flox/flox, red, N = 7 animals) and heterozygous cre (Lyz2cre/wt, Gja1flox/flox, red dashed, N = 3 animals) were compared to non-treated WT controls (black, N = 6 animals) (Log-rank (Mantel-Cox) test). (D–G) Systemic levels of TNF-alpha, IL-6, IL-33 and IL-10 in the serum of WT and MAC-CX43 KO mice operated with CLP (each dot is representative of a single animal, Mann-Whitney test). (H–K) IL-6 in peritoneal fluid (PF) serum, lungs, kidney and liver (each dot is representative of a single animal, Mann-Whitney test). Levels are expressed in pg/mg tissue respectively pg/ml of serum or peritoneal fluid. Data are representative of three or more independent experiments.

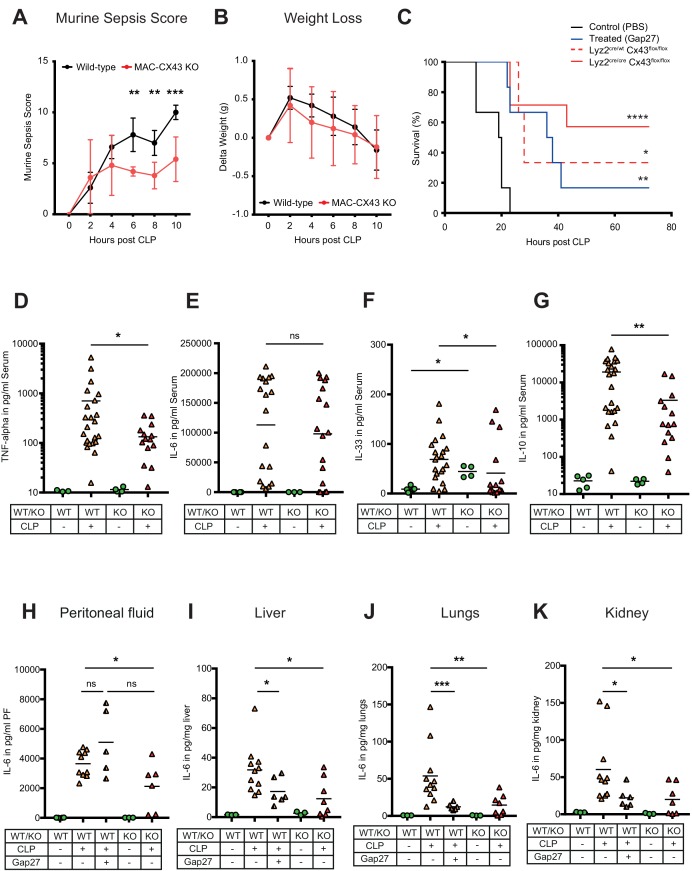
Figure 5.

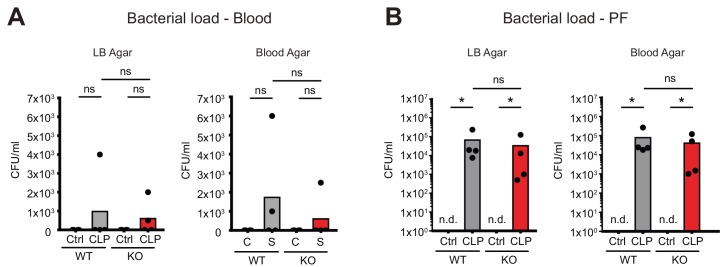
Figure 5—figure supplement 1. No consequences of Connexin-43 deletion on local and systemic bacterial load.

Figure 5—figure supplement 1.

(A–B) No difference in bacterial load as determined by CFUs after serial dilution of blood and peritoneal fluid 10 hr post CLP (N = 4 animals per group, Mann-Whitney-test).
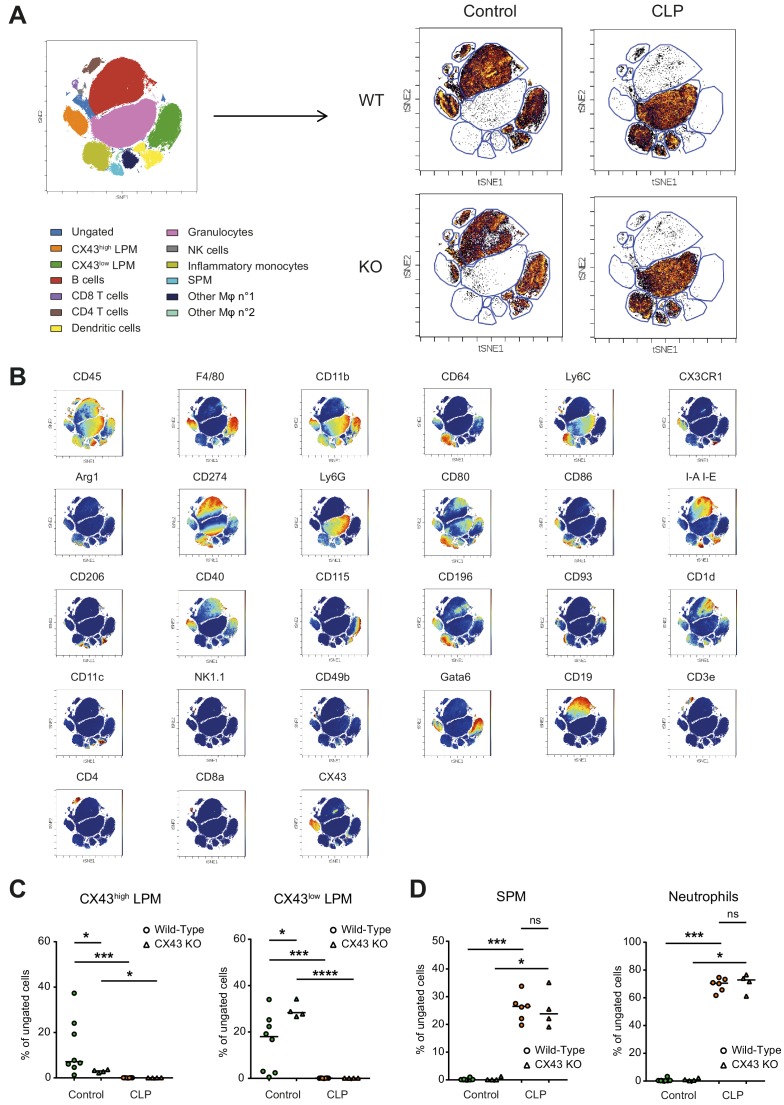
Figure 5—figure supplement 2. Impact of CX43 on inflammatory cell recruitment to the peritoneal cavity.

Figure 5—figure supplement 2.

(A) Schematic representation of clustering after CyTOF analysis and dot plot representation of tSNE analysis showing different clusters in the peritoneal cavity 10 hr after CLP compared to control animals. (B) Dot plot representation of tSNE analysis showing the different clusters of inflammatory cells present in the peritoneal cavity in controls and 10 hr after CLP and the expression of several different surface markers that enable the distinction of populations. (C) Two LPM clusters were different between WT and MAC-CX43 KO at baseline (each dot is representative of a single animal, unpaired t-test). (D) SPM and neutrophils were similar between MAC-CX43 KO and WT mice (each dot is representative of a single animal, unpaired t-test).
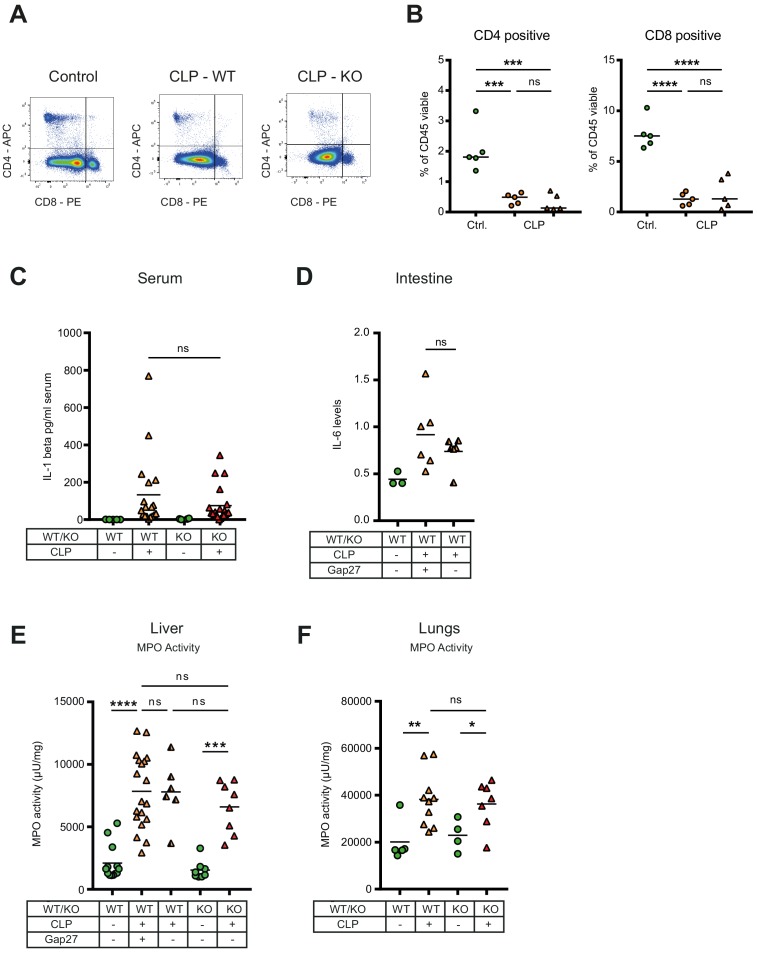
Figure 5—figure supplement 3. Consequences of peritonitis on distribution of T cells subsets, IL1beta, IL-6 and MPO.

Figure 5—figure supplement 3.

(A–B) Impact of CX43 on T-lymphocyte recruitment in the peritoneal cavity, CD4 positive T helper and CD8 cytotoxic T cells were similar between MAC-CX43 KO and WT mice (N = 5 animals per group, unpaired t-test). (C) Systemic levels of IL-1 beta in the serum of WT and MAC-CX43 KO mice operated with CLP (each dot is representative of a single animal, Mann-Whitney test). (D) Levels of IL-6 in the intestine (terminal ileum) of mice after 10 hr CLP treated or not with Gap27 and compared to controls. Levels are expressed in pg/mg tissue (each dot is representative of a single animal, unpaired t-test). (E–F) No difference on myeloperoxidase (MPO) activity in the liver (each dot is representative of a single animal, unpaired t-test).