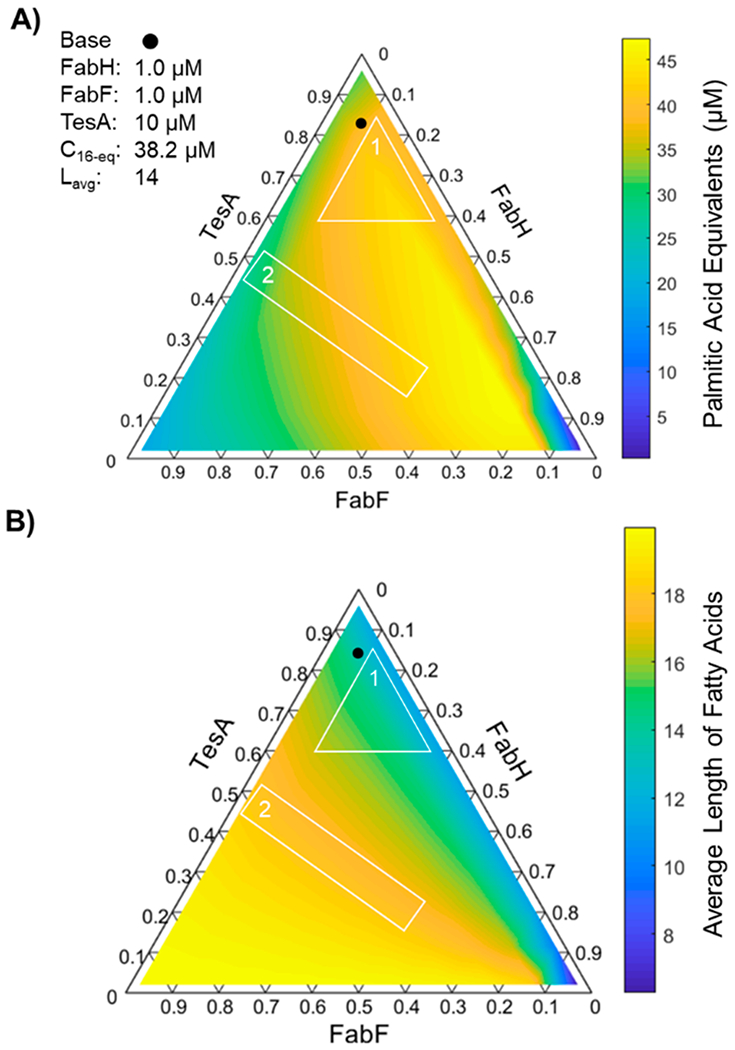
Figure 6.

Influence of relative concentrations of FabH, FabF, and TesA on FAS outputs. Ternary diagrams show (A) total production and (B) average length of fatty acids generated by modeled FASs (1 μM of each Fab, 10 μM holo-ACP, 1 mM NADPH, 1 mM NADH, 0.5 mM malonyl-CoA, and 0.5 mM acetyl-CoA, 12.5 min) in which ratios of FabH, FabF, and TesA vary (i.e., [FabH] + [FabF] + [TesA] = 12 μM). Compositional adjustments in region 1 change average length (C12–C16) but leave production levels nearly unaltered (38–43 μM); adjustments in region 2, by contrast, alter production levels (25–44 μM) but not chain length (C18). The reference point (filled circle) denotes the composition examined in Figure 2A.
