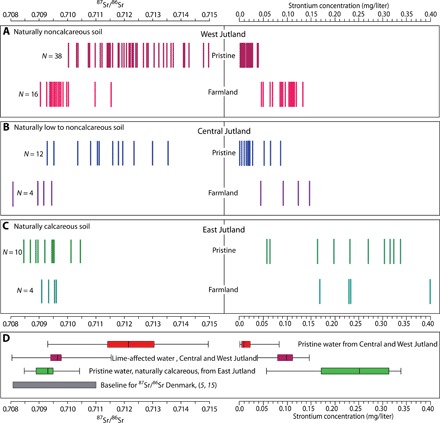
Fig. 2. 87Sr/86Sr ratios and strontium concentrations for all surface water samples.

Each sample is represented by two vertical bars, one for the 87Sr/86Sr ratio and one for the strontium concentration. The samples are subdivided into three main groups following the geological division of the study area: (A) Samples from the noncalcareous West Jutland, (B) samples from the low to noncalcareous Central Jutland, and (C) samples from the calcareous East Jutland. Within each of these geological zones, samples from pristine areas and samples from farmland areas are distinguished. (D) Box and whisker plots (25, 50, 75, and 100%) of 87Sr/86Sr ratios and strontium concentrations, with pristine samples from the low to noncalcareous West and Central Jutland added together, farmland samples from the low to noncalcareous West and Central Jutland added together, pristine samples from calcareous East Jutland, and the 87Sr/86Sr baseline for Denmark of Frei and Frei (5, 15). N = number of samples in each category.
