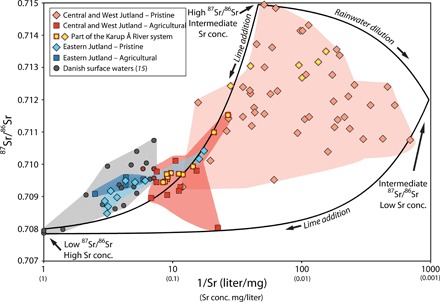
Fig. 3. Strontium concentration versus 87Sr/86Sr ratio for Danish surface water samples.

Samples are subdivided into two groups following the geological subdivisions of the study area: (i) the noncalcareous West Jutland and low to noncalcareous Central Jutland and (ii) the calcareous East Jutland. The samples are classified as pristine or agricultural. Previously published samples (15), marked with gray dots are classified as agricultural. Shaded areas show the range in strontium concentrations (Sr conc.) and 87Sr/86Sr ratios for each group. Samples from Karup River are marked with internal yellow circles. Hypothetical mixing lines are shown for three end-members: (i) low 87Sr/86Sr, high Sr concentration waters derived from limestone; (ii) intermediate 87Sr/86Sr, low Sr concentration waters derived from quartz sand or dominated by rainwater; and (iii) high 87Sr/86Sr intermediate Sr concentration waters derived from quartz sand with significant input from felsic rocks. Data for samples from (15) obtained from the same geographical locations as those obtained in the course of this study (n = 4) are each marked with a colored dot corresponding to geographical location and sample classification. Analytical uncertainties in the y-axis values are smaller than the data symbols. Analytical uncertainties in the x-axis values are about the size of the data symbols for low-concentration samples and are smaller for high-concentration samples.
