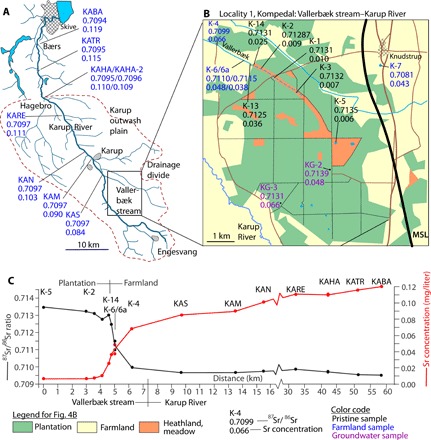
Fig. 4. Variability in 87Sr/86Sr ratio and strontium concentration in the Vallerbæk stream-Karup River catchment area.

(A) Strontium data along the main run of Karup River with location of the Vallerbæk tributary indicated. (B) Detailed map of Kompedal Plantage and Vallerbæk tributary with sample positions and strontium data indicated. (C) Strontium concentration and 87Sr/86Sr ratios for Vallerbæk stream and Karup River as a function of distance from the head of Vallerbæk stream. Maps are based on data from “Styrelsen for Dataforsyning og Effektivisering, skærmkortet, WMS-tjeneste.”
