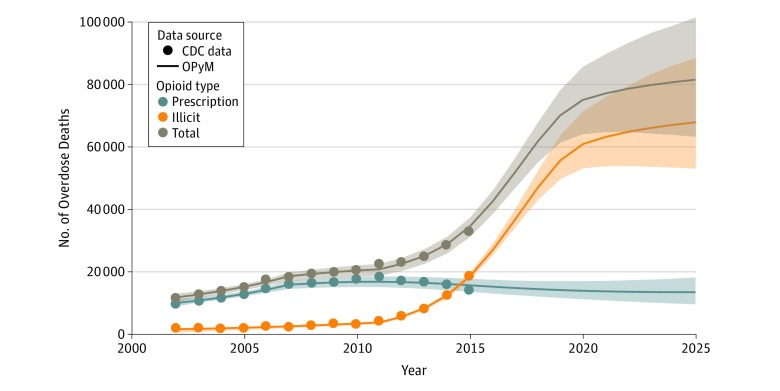
Figure 2. Overdose Deaths From Prescription and Illicit Opioids From 2002 to 2025 Under the Base-Case Projection Scenario.
The model closely replicated the overdose deaths reported by the Centers for Disease Control and Prevention (CDC) from 2002 to 2015 and projected that the number of overdose deaths will increase substantially from 2016 onward. The lines are the average outcomes across 1000 calibrated parameter sets. Shaded regions represent the bootstrapped 95% uncertainty intervals of the model outcomes. OPyM indicates opioid policy model.

