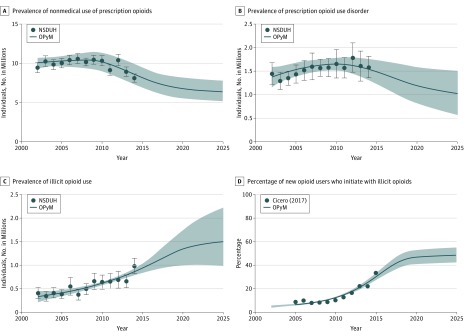
Figure 3. Temporal Trends in the Opioid Overdose Crisis for the Base-Case Scenario, 2002-2025.
A, Prevalence of nonmedical use of prescription opioids. B, Prevalence of prescription opioid use disorder. C, Prevalence of illicit opioid use. D, Percentage of individuals who initiate opioid use with an illicit opioid (rather than a prescription opioid). The model was calibrated to closely replicate observed outcomes from 2002 to 2015 and used to project outcomes from 2015 to 2025. Lines represent the average of 1000 outcomes from the model. Error bars represent 95% confidence intervals of the observed outcomes from the National Survey on Drug Use and Health (NSDUH) data, and shaded regions represent the bootstrapped 95% uncertainty intervals of the model outcomes. Cicero (2017)17 indicates the source of calibration targets; and OPyM, opioid policy model.

