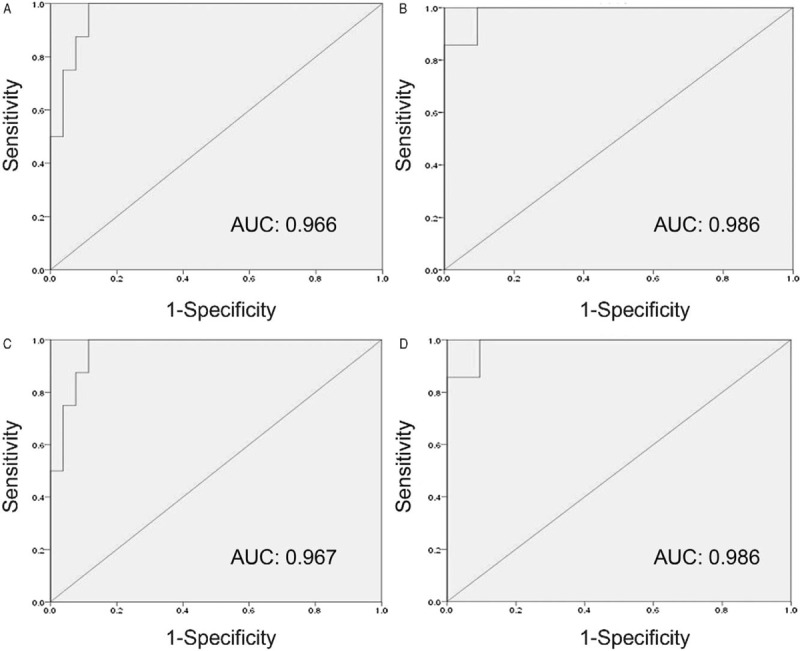
Figure 2.

Receiver operating characteristic curve analysis of AUC/MIC and Cmax/MIC in predicting the efficacy. (A) ROC curve of AUC/MIC as a predictor of clinical efficacy. (B) ROC curve of Cmax/MIC as a predictor of clinical efficacy. (C) ROC curve of AUC/MIC as a predictor of bacteriologic efficacy. (D) ROC curve of Cmax/MIC as a predictor of bacteriologic efficacy. AUC: Area under the drug serum concentration-time curve; Cmax: Maximum serum concentration of the drug; MIC: Minimum inhibitory concentration of the drug for the pathogen; ROC: Receiver operating characteristic.
