
FIGURE 3.
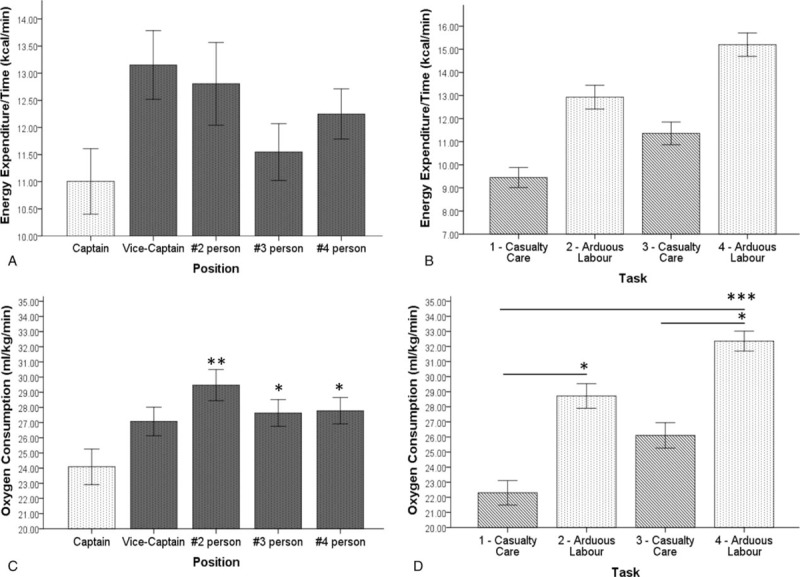
(A) Mean energy expenditure for each position across of all tasks; (B) mean energy expenditure for each task across all participants; (C) mean oxygen consumption for each position across all tasks; (D) mean oxygen consumption for each task across all participants; significance was accepted at P < 0.05 (∗P < 0.05, ∗∗P < 0.01, and ∗∗∗P < 0.005).