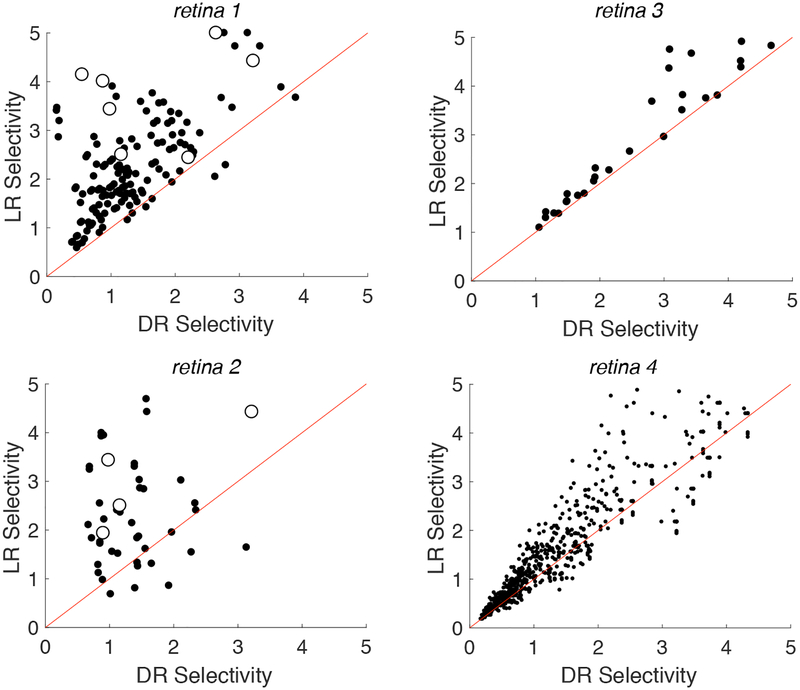
Figure 3. Impact of local returns on selectivity.
Each point in the scatter plots indicate selectivity calculated for a near target cell (red points from Fig. 2) and an intermediate non-target cell (blue points from Fig. 2) with local return (LR) and distant return (DR) stimulation. Red diagonals denote the reference line y = x. Selectivity is defined as the ratio of non-target cell threshold to target cell threshold. Open symbols represent cases in which the target and non-target cells were actually recorded and stimulated simultaneously on the same set of electrodes

