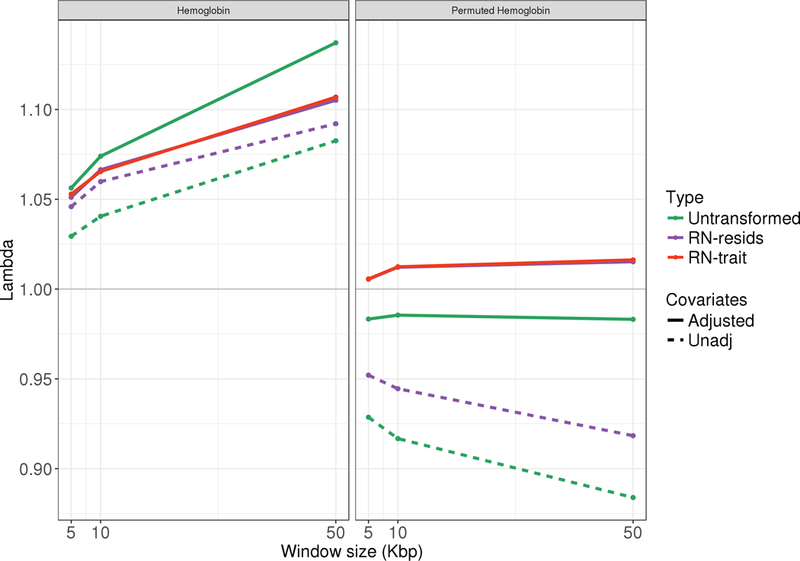
Figure 4: Observed inflation factors in SKAT analyses of the TOPMed Hemoglobin dataset.

The figure provides the observed inflation factors lambda = in testing variants with alternate allele frequencies between 0 to 0.01 in non-overlapping window of sizes 5,10, and 50 Kbp. The left panel corresponds to the true hemoglobin trait, and the right panel correspond to the same analyses applied on permuted values of the observed hemoglobin.
