
Figure 8.
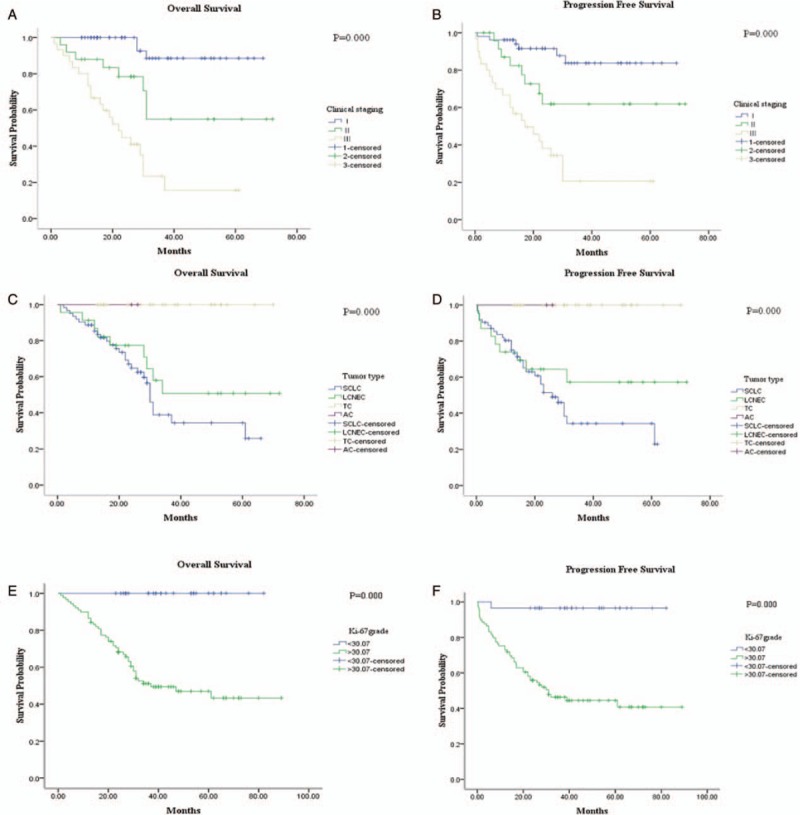
The relationship between OS and PFS with clinical staging were performed by the univiarate analysis. The early stage pNETs showed (A) better OS (P = 0.000) and (B) PFS (P = 0.000) with advanced cases. The Ki-67 index was classified as two groups by CAIM: ≤ 30.07% and > 30.07%. SCLC and LCNEC presented with worse OS (C) and PFS (D) compared with low grade NETs. The Ki-67 value ≤ 30.07% showed a (E) better OS (P = 0.000) and (F) better PFS (P = 0.000) than Ki-67 index > 30.07%.