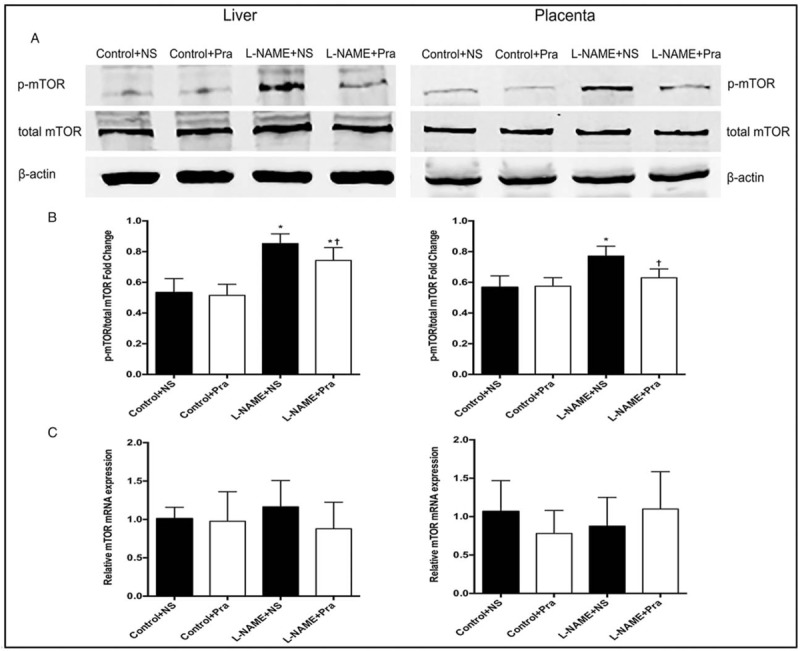
Figure 1.

Effects of pravastatin on mTOR protein activation and mRNA expression in the maternal liver and placental tissues detected using Western blot analysis (n = 8). (A and B) The degree of phosphorylation of mTOR protein and statistical values. (C) mRNA expression levels of mTOR in each group. The left panel is liver tissue, and the right panel is placental tissue. ∗ P < 0.05, compared with the Control + NS group; + P < 0.05, compared with the L-NAME + NS group. NS: Normal saline; Pra: Pravastatin.
