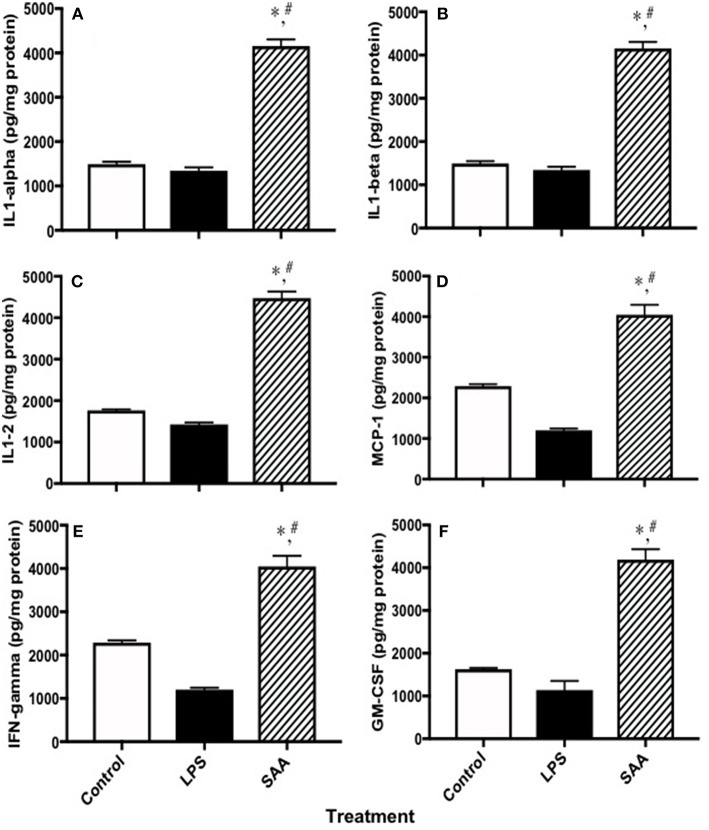
Figure 7.
Cytokines and chemokines in kidneys from control, LPS and SAA-treated mice. ApoE−/− mice were administered SAA, LPS or sterile PBS for 2 weeks (as described in Study 1). After a further 2 weeks mice were sacrificed and levels of (A) IL-1α, (B) IL-1β, (C) IL-2, (D) MCP-1, (E) IFN-γ, and (F) GM-CSF were determined in kidney homogenates with a commercial Multiplex kit. Data expressed as mean ± SD: control (n = 7), LPS (n = 8) and SAA (n = 6). *Different to the control; P < 0.05. #Different to the LPS group; P < 0.05. Note, renal levels of IL-3, IL-4, IL-5, IL-6, IL-10, IL-12p70, IL-17, TNFα, MIP-1α, and RANTES that were determined on the same ELISA plate were all markedly elevated above those detected in vehicle- and LPS-treated (control) mice albeit this was above the maximum detection limit and therefore, not quantified.

