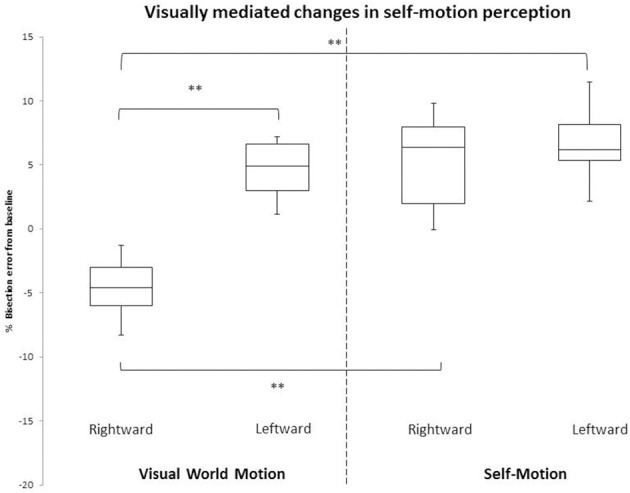
Figure 6.

From section, The effect of self-motion perception on numerical magnitude allocation. This Figure, modified from Arshad et al. (306). Graph showing percentage error in the number bisection task (normalized to 0% error by subtracting the baseline) for the four perceptual conditions: world motion right and left and self-motion (vection) right and left. Box-plots represent the median and interquartile range with whiskers denoting 10th and 90th percentile. **Marks significance at p < 0.01.
