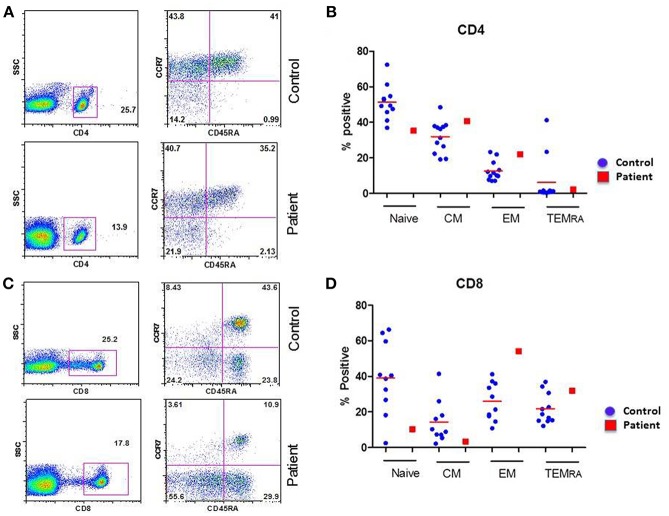
Figure 1.
Subsets of CD4+ (A,B) and CD8+ (C,D) T cells. (A,C) are flow cytograph from the patient and a simultaneously analyzed healthy control. (B,D) show individual data from 10 healthy controls and the patient. CD8 TEM cells are increased, and CD8 TN and CD8 TCM cells are decreased in the patient.

