Figure 3.
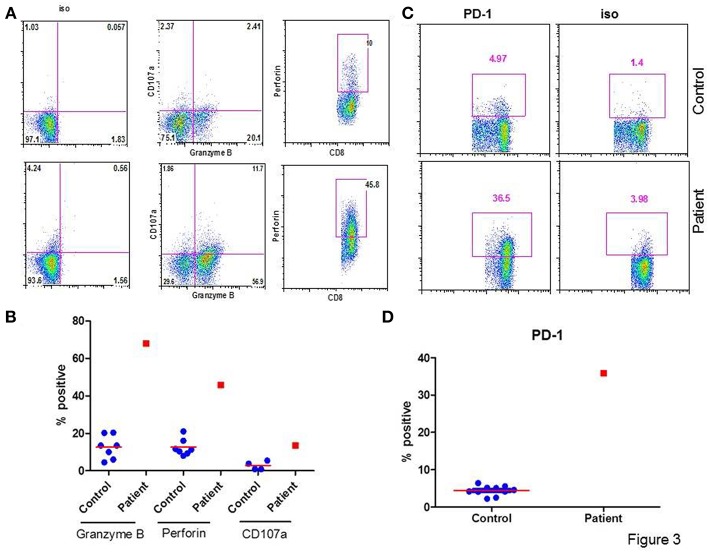
Granzyme B+, Perforin+, and PD-1+ CD8+ T cells. (A) shows a flow cytograph for 107a+, granzyme B+, and perforin + CD8+ T cells. (B) shows individual data from 5 healthy control subjects and the patient. (C) shows a flow cytograph of PD-1+CD8+ T cells in the patient and a simultaneously-analyzed healthy control. (D) show individual data of PD-1+ CD8+ T cells in 10 healthy controls and the patient. Granzyme B+, CD107a+, Perforin +, and PD-1+ CD8+ T cells are increased in the patient.

