Figure 7.

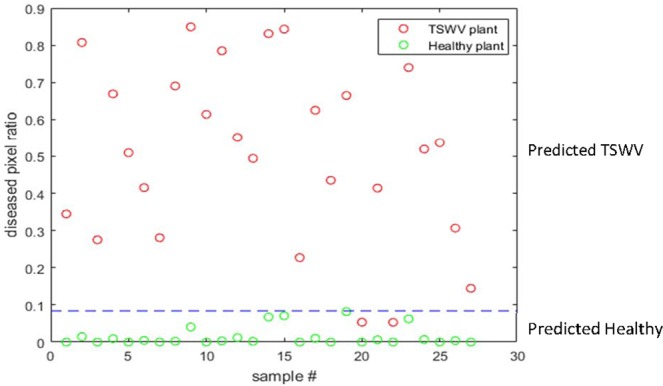
The classificaiton result of an independent test dataset, where the predicted healthy and diseased plants can be separated by the threshold TD determined by the algorithm in Fig. 3 based on the diseased pixel ratio of a plant.

The classificaiton result of an independent test dataset, where the predicted healthy and diseased plants can be separated by the threshold TD determined by the algorithm in Fig. 3 based on the diseased pixel ratio of a plant.