
Figure 2.
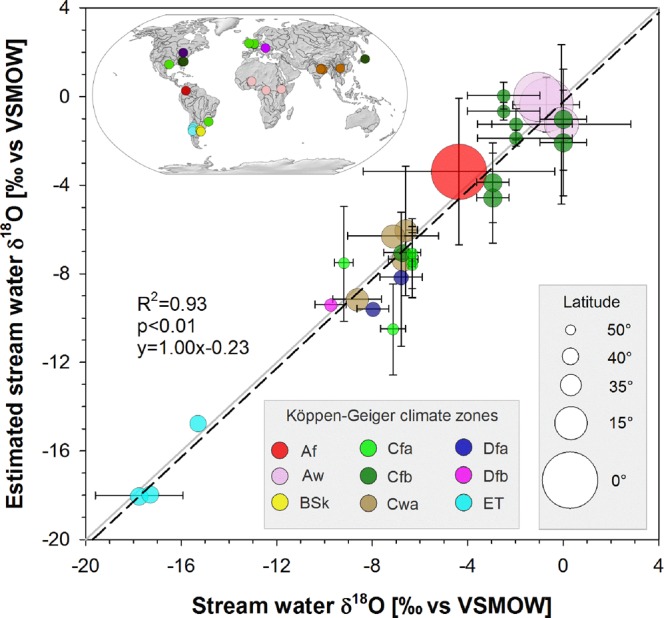
δ18O signals in stream water [mean δ18O values with standard deviations] and δ18O signals estimated (accounting for temperature effects) from shell δ18O values [mean δ18O values with standard deviations] for 22 river basins [map] and 9 Köppen-Geiger12 climate zones. Stream water δ18O = oxygen isotopic composition of the water, expressed as a deviation in ‰ from the Vienna Standard Mean Ocean Water (VSMOW). Grey line: 1:1 line. Black dashed line: regression line (slope = 1.00). Colored dots: Köppen-Geiger12 climate zones in mollusk sampling locations ([Main climate–Precipitation–Temperature]; Af: Equatorial–fully humid; Aw: Equatorial–winter dry; BSk: Arid–summer dry–cold arid; Cfa: Temperate–fully humid–hot summer; Cfb: Temperate–fully humid–warm summer; Cwa: Temperate–winter dry–hot summer; Dfa: Cold–fully humid–hot summer; Dfb: Cold–fully humid–warm summer; ET: polar tundra. Dot size is proportional to the latitude of the shell and water sampling site. The map was created in ArcGIS version 10.5 (http://desktop.arcgis.com/) using free vector and raster map data [ne_50m_rivers_lake_centerlines; ne_110m_coastline; ne_110m_ocean; MSR_50M] made available by Natural Earth (http://naturalearthdata.com). All maps are in the public domain (http://www.naturalearthdata.com/about/terms-of-use/).