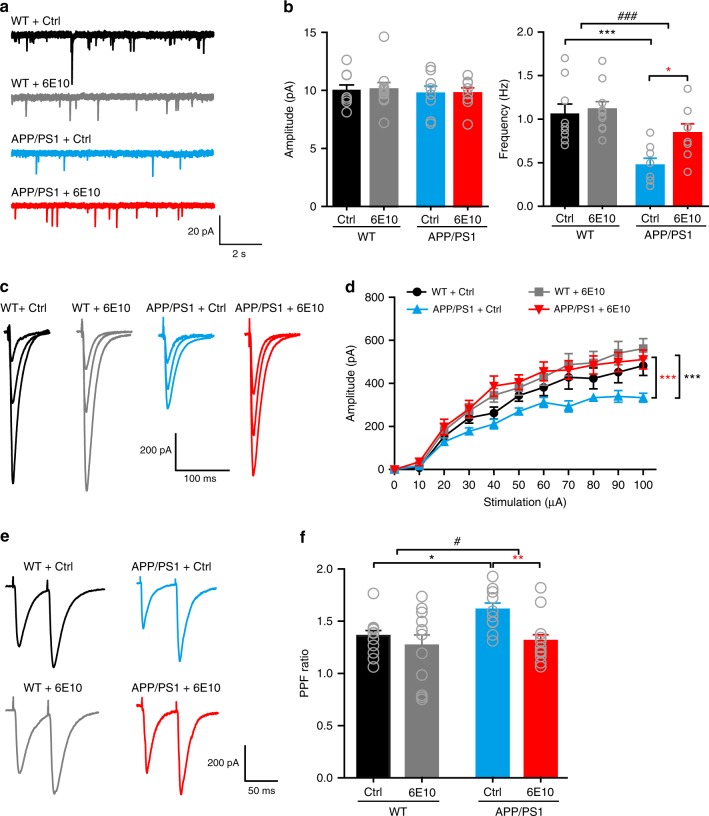
Fig. 3.
Blocking Aβ with anti-β-amyloid antibody 6E10 rescues the presynaptic deficit in hippocampal slices from 6–7-month-old APP/PS1 mice. a, b Representative traces (a) of mEPSCs in CA1 pyramidal neurons and quantification (b) of mEPSC amplitude (left) and frequency (right) in hippocampal slices from WT and APP/PS1 mice incubated in control (Ctrl) ACSF or ACSF containing 6E10. Two-way ANOVA with post hoc Bonferroni test; left panel: animal, F(1,31) = 0.286, P = 0.597; treatment, F(1,31) = 0.0119, P = 0.914; right panel: animal, F(1,31) = 18.66, P < 0.001; treatment, F(1,31) = 4.64, P = 0.039; *P < 0.05; ***P < 0.001; ###P < 0.001 (APP/PS1 vs. WT); N = 8–10 per group. c, d Representative traces of SC-CA1 EPSCs evoked by stimulus intensities of 20, 40, and 100 μA (c) and quantification of EPSC amplitude to stimulus intensity (d) in hippocampal slices from WT and APP/PS1 mice incubated in Ctrl ACSF or ACSF containing 6E10. Two-way ANOVA with post hoc Bonferroni test; animal, F(3,341) = 19.694, P < 0.001; treatment, F(10,341) = 32.140, P < 0.001; ***P < 0.001 (compared with APP/PS1 + Ctrl group); N = 7–10 per group. e, f Representative traces (e) and quantification (f) of PPF of SC-CA1 EPSCs in hippocampal slices from WT and APP/PS1 mice incubated in Ctrl ACSF or ACSF containing 6E10. Two-way ANOVA with post hoc Bonferroni test; animal, F(1,43) = 4.069, P = 0.049; treatment, F(1,43) = 7.219, P = 0.01; *P < 0.05; **P < 0.01; #P < 0.05 (APP/PS1 vs. WT); N = 10–13 per group. Source data are provided as a Source Data file

