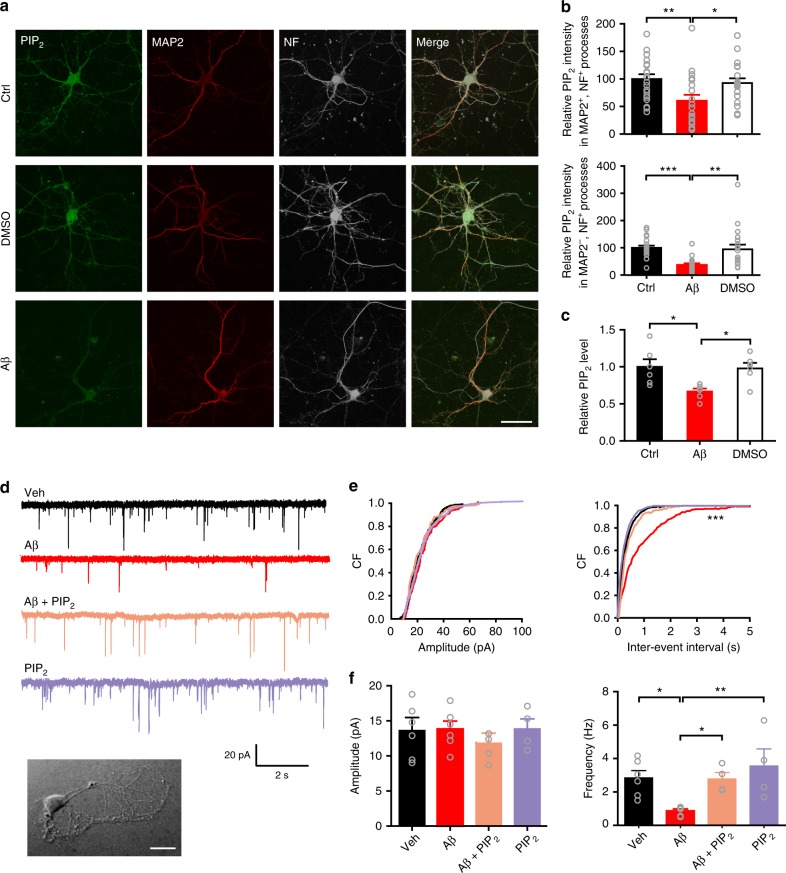
Fig. 4.
Reduced axonal PIP2 accounts for oligomeric Aβ-induced suppression of presynaptic release probability at the SC-CA1 synapse. a Confocal images of primary hippocampal neurons showing colocalization of PIP2, MAP2, and neurofilament (NF) along neuronal processes in control, DMSO-treated, and oligomeric Aβ-treated hippocampal neurons. Bar, 50 μm. b Histograms showing oligomeric Aβ suppresses PIP2 levels significantly in both dendrites (MAP2+, NF+, upper panel) and axons (MAP2−, NF+, bottom panel). One-way ANOVA with post hoc Dunnett’s test; F(2,55) = 4.95 (upper); F(2,55) = 9.39 (bottom); *P < 0.05; **P < 0.01; ***P < 0.001; N = 19–20 per group. c Quantification of PIP2 levels measured with ELISA showing oligomeric Aβ suppresses PIP2 in cultured hippocampal neurons. One-way ANOVA with post hoc Dunnett’s test; F(2,15) = 5.87; *P < 0.05; N = 6 per group. d Representative traces of mEACs recorded from isolated hippocampal neurons (an example shown in inset at bottom) in vehicle-treated medium (Veh), oligomeric Aβ-supplemented medium (Aβ), oligomeric Aβ-supplemented medium with intracellular application of PIP2 (Aβ + PIP2), or vehicle-treated medium with intracellular application of PIP2 (PIP2). Bar, 50 μm. e, f Cumulative plots (e) and mean values (f) of mEAC amplitude (left) and frequency (right) in isolated hippocampal neurons in various conditions. Kolmogorov-Smirnov test in e; one-way ANOVA with post hoc Dunnett’s test in f, F(3,16) = 0.54 (amplitude); F(3,16) = 5.47 (frequency); *P < 0.05; **P < 0.01; ***P < 0.001; N = 4–6 per group. Data are mean ± SEM. Source data are provided as a Source Data file

