Fig. 6.
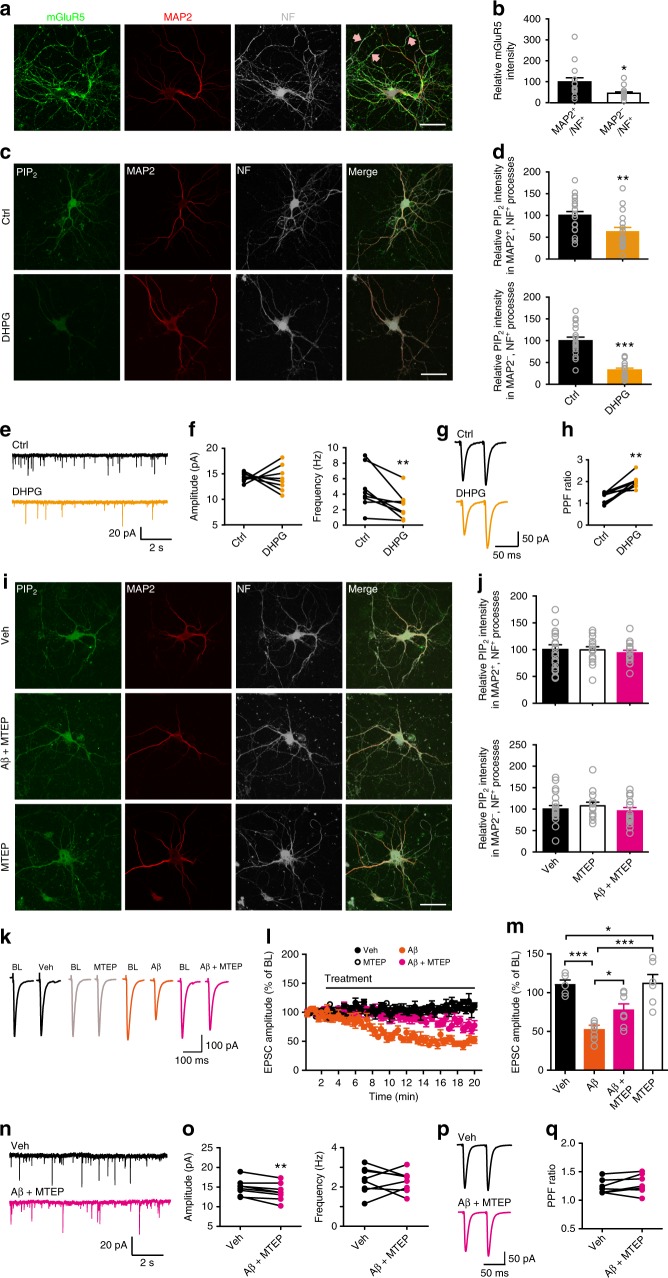
Oligomeric Aβ-induced PIP2 reduction and presynaptic deficit involve mGluR5 activation. a Confocal images of primary hippocampal neurons showing colocalization of mGluR5, MAP2, and NF along neurites. Arrows: mGluR5 + axons. Bar, 50 μm. b Quantification of relative mGluR5 intensity in neurites. t test; *P < 0.05; N = 15 per group. c Confocal images of primary hippocampal neurons showing the effect of DHPG on PIP2 levels in neurites. Bar, 50 μm. d Quantification of relative PIP2 intensity in dendrites (upper) and axons (bottom) in control vs. DHPG conditions. t test; **P < 0.01; ***P < 0.001; N = 17–19 per groups. e–h Representative traces of mEPSCs (e) and PPF (g), and quantification of mean values of mEPSC amplitude (f, left) and frequency (f, right) and PPF ratio (h) before (ctrl) and after DHPG treatment. t test; **P < 0.01; N = 8 per group. i Confocal images of primary hippocampal neurons showing the effect of Aβ on PIP2 levels in neurites in the presence of MTEP. Bar, 50 μm. j Quantification of relative PIP2 intensity in dendrites (upper) and axons (bottom) in control vs. MTEP conditions. One-way ANOVA with post hoc Dunnett’s test; F(2,48) = 0.23 (upper); F(2,48) = 0.51 (bottom); P > 0.05; N = 16–19 per group. k, l Representative traces (k) and the time course of the normalized amplitude (l) of SC-CA1 EPSCs in WT hippocampal slices before (BL) and after drug treatment (Veh, Aβ, Aβ + MTEP, or MTEP). m Quantification of relative amplitude of SC-CA1 EPSCs recorded in the last 1 min of drug treatment shown in (l). One-way ANOVA with post hoc Dunnett’s test; F(3,24) = 14.1; *P < 0.05; ***P < 0.001; N = 5–7 per group. n–q Representative traces of mEPSCs (n) and PPF (p), and quantification of mEPSC amplitude (o, left) and frequency (o, right) and PPF ratio (q) before (Veh) and after Aβ + MTEP treatment. t test; **P < 0.01; N = 7–8 per group. Data are mean ± SEM. Source data are provided as a Source Data file

