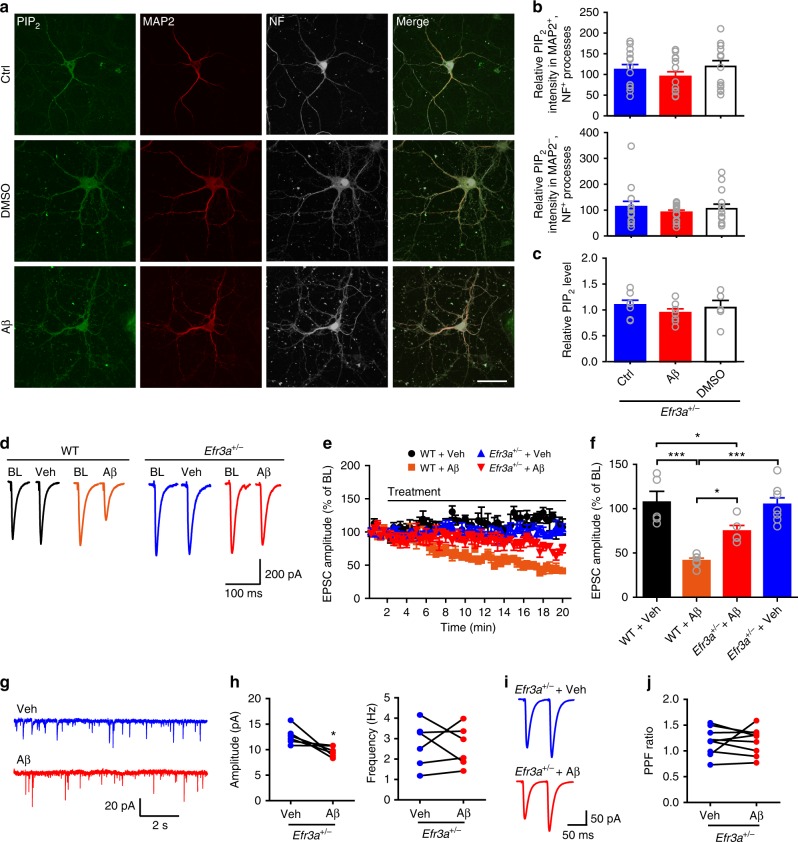
Fig. 7.
Oligomeric Aβ-induced PIP2 reduction and presynaptic deficit are rescued by knocking down Efr3a. a Confocal images showing the effect of oligomeric Aβ on PIP2 levels in neuronal processes in primary hippocampal neurons from Efr3a+/− mice. Bar, 50 μm. b Quantification of relative PIP2 intensity in dendrites (upper panel) and axons (bottom panel) showing knocking down Efr3a prevents Aβ-induced suppression of PIP2 in neurites. One-way ANOVA with post hoc Dunnett’s test; F(2,39) = 0.98 (upper); F(2,49) = 0.44 (bottom); P > 0.05; N = 14 per group. c Quantitative results showing knocking down Efr3a prevents Aβ-induced suppression of PIP2 in cultured hippocampal neurons (measured by PIP2 ELISA). One-way ANOVA with post hoc Dunnett’s test; F(2,16) = 0.66; P > 0.05; N = 5–7 per group. d, e Representative traces (d) and the time course of normalized amplitude (e) of SC-CA1 EPSCs in WT and Efr3a+/− hippocampal slices before (BL) and after drug treatment (Veh or Aβ). f Bar graph representing the relative magnitude of EPSCs recorded in the last 1 min of drug treatment shown in e. One-way ANOVA with post hoc Dunnett’s test; F(3,23) = 16.88; *P < 0.05; ***P < 0.001; N = 5–8 per group. g, h Representative traces (g) and quantification (h) of mean values of the amplitude (left) and frequency (right) of mEPSCs in CA1 pyramidal neurons in Efr3a+/− mice showing oligomeric Aβ treatment no longer inhibits mEPSC frequency. t test; *P < 0.05; N = 6 per group. i, j Representative traces (i) and quantification (j) of PPF of SC-CA1 EPSCs showing oligomeric Aβ does not alter PPF ratio in Efr3a+/− mice. t test; P > 0.05; N = 9 per group. Data are mean ± SEM. Source data are provided as a Source Data file

