Fig. 8.
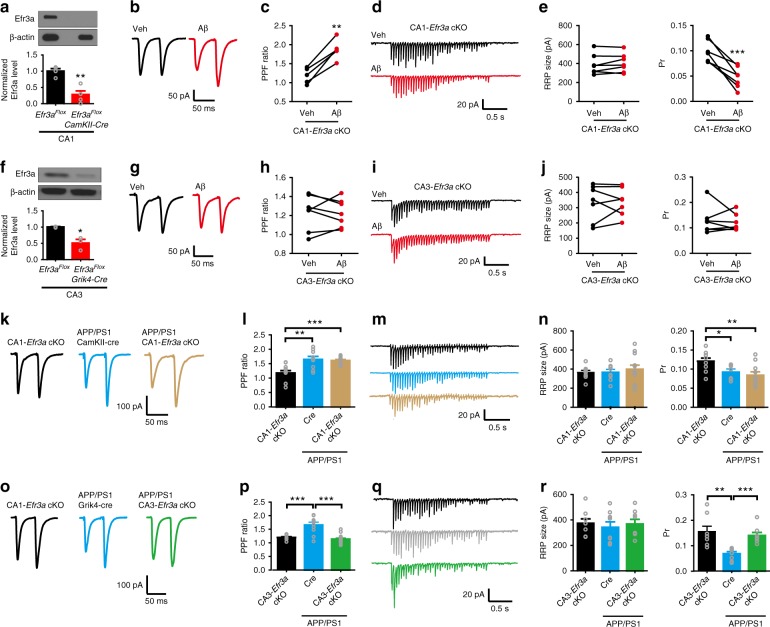
Selectively knocking out Efr3a in the CA3 area prevents oligomeric Aβ-induced inhibition of presynaptic release probability at the SC-CA1 synapse. a–j Representative traces of PPF (b, CA1-Efr3a cKO mice; g, CA3-Efr3a cKO mice) and 20 Hz train responses (d, CA1-Efr3a cKO mice; i, CA3-Efr3a cKO mice) and quantification of PPF ratio (c, CA1-Efr3a cKO mice; h, CA3-Efr3a cKO mice), RRP size (e, CA1-Efr3a cKO mice; j, CA3-Efr3a cKO mice; left), and Pr (e, CA1-Efr3a cKO mice; j, CA3-Efr3a cKO mice; right) at the SC-CA1 synapse showing oligomeric Aβ (400 nM) increases Pr in CA1-Efr3a cKO mice (immunoblotting and quantification of Efr3a in CA1 shown in a), whereas oligomeric Aβ no longer changes Pr in CA3-Efr3a cKO mice (immunoblotting and quantification of Efr3a in CA3 shown in f). t test; *P < 0.05; **P < 0.01; ***P < 0.001; N = 3–7 per group. k–r Representative traces of PPF (k, APP/PS1 CA1-Efr3a cKO and control mice; o, APP/PS1 CA3-Efr3a cKO and control mice) and 20 Hz train responses (m, APP/PS1 CA1-Efr3a cKO and control mice; q, APP/PS1 CA3-Efr3a cKO and control mice) and quantification of PPF ratio (l, APP/PS1 CA1-Efr3a cKO and control mice; p, APP/PS1 CA3-Efr3a cKO and mice), RRP size (n, APP/PS1 CA1-Efr3a cKO and control mice; r, APP/PS1 CA3-Efr3a cKO and control mice; left), and Pr (n, APP/PS1 CA1-Efr3a cKO and control mice; r, APP/PS1 CA3-Efr3a cKO and mice; right) at the SC-CA1 synapse showing selectively knocking out Efr3a in the CA3 area restores the decreased Pr in APP/PS1 mice. One-way ANOVA with post hoc Dunnett’s test; F(2,29) = 11.38 (l); F(2,31) = 20.66 (p); F(2,26) = 0.28 (n, left); F(2,26) = 5.99 (n, right); F(2,21) = 0.986 (r, left); F(2,21) = 0.19 (r, right); *P < 0.05; **P < 0.01; ***P < 0.001; N = 8–15 per group. Data are mean ± SEM. Source data are provided as a Source Data file

