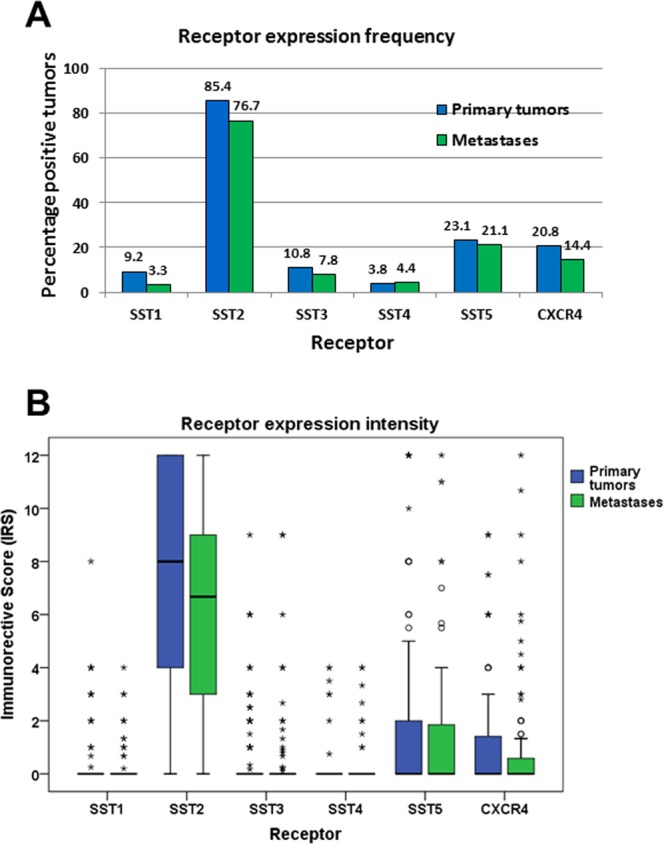
Figure 2.

Expression profiles of different somatostatin receptor (SST) subtypes and CXCR4 chemokine receptor in primary tumors and metastases of gastroenteropancreatic neuroendocrine neoplasms. (A) Percentage of positive cases for different SSTs and CXCR4. Tumors were only considered positive at IRS values ≥3. (B) Box plots of somatostatin receptor (SST) and CXCR4 expression levels (IRS values). Depicted are median values, upper and lower quartiles, minimum and maximum values, and outliers. Outliers are defined as follows: circles: mild outliers; data that fall between 1.5 and 3 times above the upper quartile or below the lower quartile; asterisks: extreme outliers; data that fall more than 3 times above the upper quartile or below the lower quartile.
