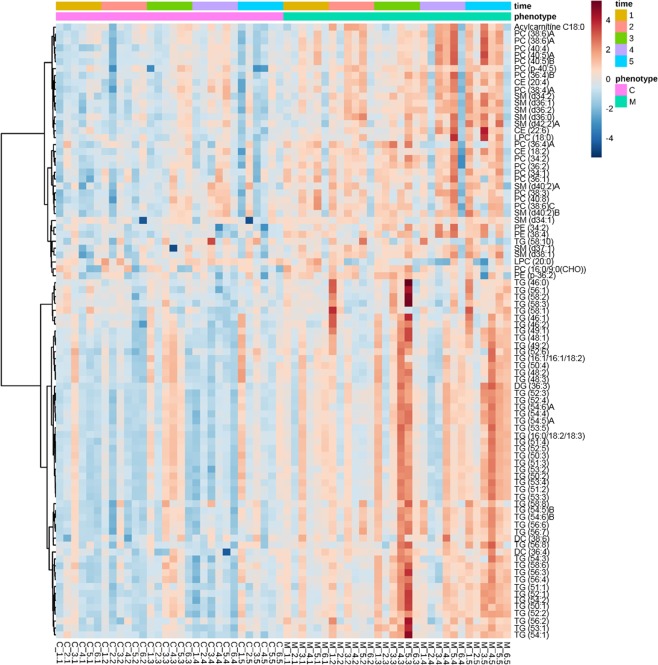
Figure 1.
Heatmap clustering lipids in plasma from meloxicam-treated (n = 6) and saline-treated (n = 6) cats before (time 1) and after the administration of saline or meloxicam at 0.3 mg/kg every 24 h for up to 17 days (times 2 to 5). For simplicity, the figure only displays lipids with intensities that were different (p < 0.05) based on ANOVA. The higher the signal intensity of a lipid, the more red in the heatmap gradient colors. The lower the signal intensity of a lipid, the bluer in the heatmap gradient colors. Each row corresponds to a lipid. Each column represents each cat at a given sampling time. Data is clustered based on phenotype.

