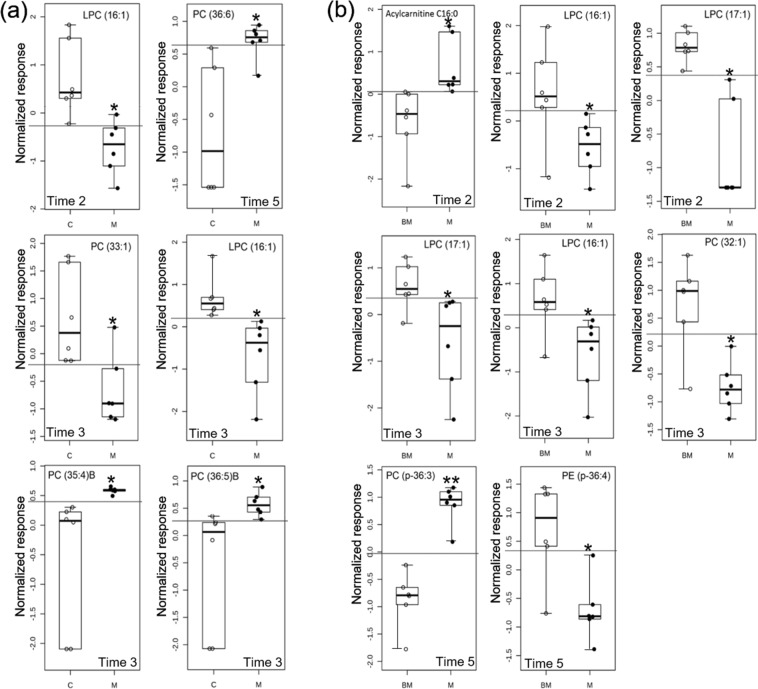
Figure 4.
Comparison of the normalized signal intensity of lipids in urine that were identified as biomarker candidates for discriminating (a) meloxicam-treated (M) (n = 6) and saline-treated (C) cats (n = 6); and (b) baseline (BM) and meloxicam group (M) at different times after the administration of saline or meloxicam at 0.3 mg/kg every 24 h for up to 17 days (times 2 to 5). The lines in the boxes represent the median intensity value for each lipid; the upper and lower boundaries of the box indicate the 75th and 25th percentiles, respectively; the upper and lower whiskers represent the maximum and minimum values. The horizontal lines in the ROC boxes indicate the highest sensitivity and specificity in separating between control and meloxicam animals. *p < 0.05 and **p < 0.001.

